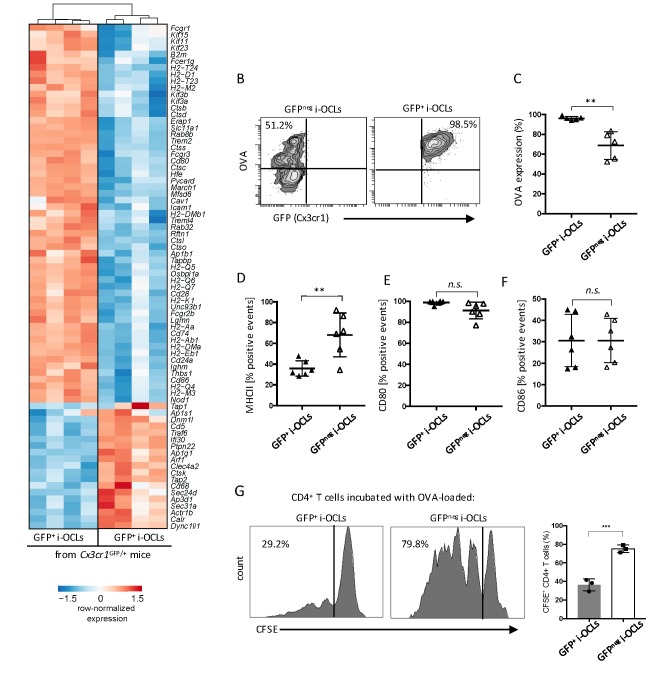
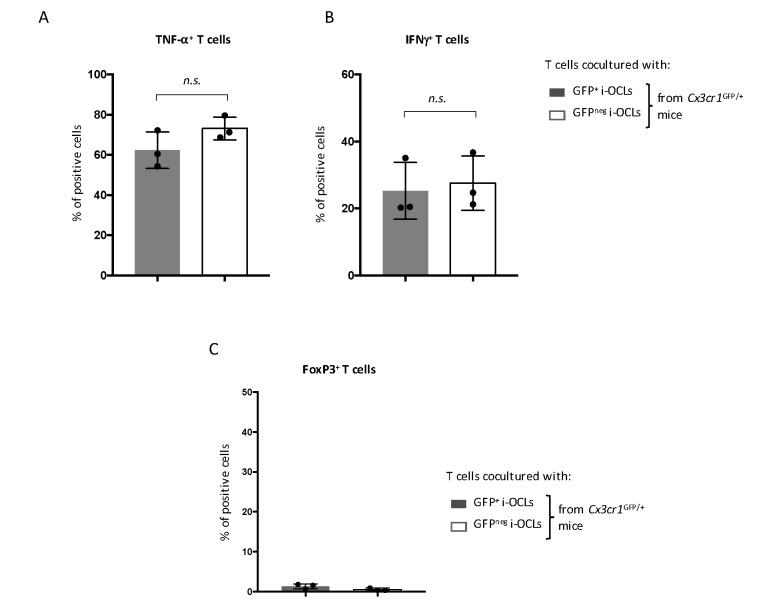
Figure 5. Cx3cr1neg and Cx3cr1+ subsets differ in their antigen uptake and presentation.
(A) Heatmap visualization of the z-scored expression for selected genes involved in antigen uptake, processing and presentation that are differentially expressed between GFP+ (Cx3cr1+) and GFPneg (Cx3cr1neg) i-OCLs from WT Cx3cr1GFP/+ mice (adjusted pVal <0.05, FC ≥2). (B) Representative FACS plots of OVA uptake in Cx3cr1+ and Cx3cr1neg i-OCLs. (C) Quantification of FACS analysis for OVA uptake in GFP+ (Cx3cr1+) and GFPneg (Cx3cr1neg) i-OCLs (n = 5). (D–F) FACS analysis of GFP+ (Cx3cr1+) and GFPneg (Cx3cr1neg) i-OCLs for (D) MHC-II, (E) CD80 and (F) CD86 (n = 6). (G). Representative FACS histograms for T cell proliferation assay of CFSE-labelled CD4+ T cells from OT-II mice cultured with OVA-loaded GFP+ (Cx3cr1+) or GFP neg (Cx3cr1neg) i-OCLs after 5 days of coculture. **p<0.01; n.s., no significant difference.


