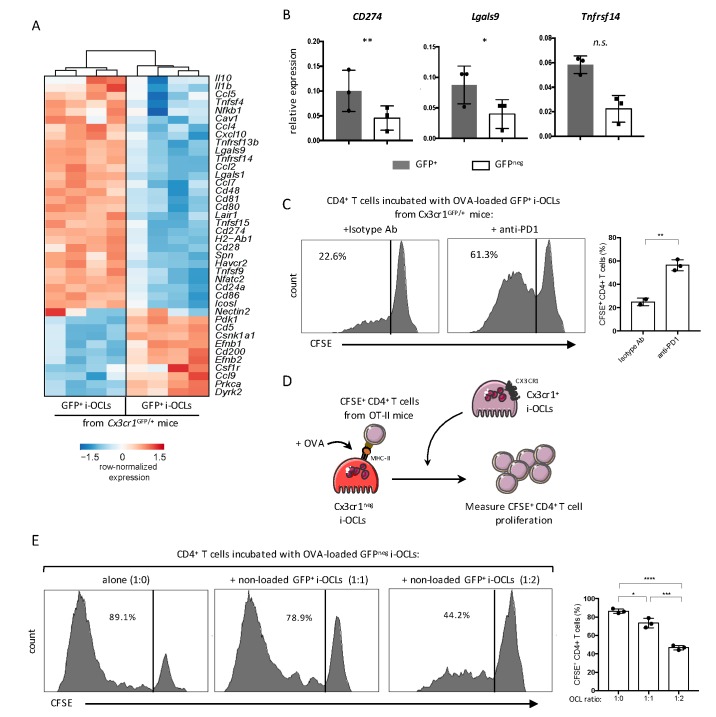
Figure 6. Cx3cr1neg and Cx3cr1+ subsets differ in their T cell activation capacity.
(A) Heatmap visualization of the z-scored expression for selected genes involved in T cell stimulation and inhibition that are differentially expressed between GFP+ (Cx3cr1+) and GFPneg (Cx3cr1neg) i-OCLs from WT Cx3cr1GFP/+ mice (adjusted p<0.05, FC ≥2). (B) RT-qPCR analysis of immunosuppressive molecules. Graphs show three independent experiments conducted in triplicates. (C) Representative FACS histograms and quantification of the proliferation of CSFE-labelled CD4+ T cell from OT-II mice cocultured with OVA-loaded Cx3cr1+ i-OCLs from WT Cx3cr1GFP/+ mice and an isotype antibody (left panel) or an anti-PD-1 antibody (right panel). (D) Schematic representation of the experimental setup. Sorted GFPneg (Cx3cr1neg) i-OCLs from WT Cx3cr1GFP/+ mice were loaded with OVA for 3 hr and incubated with CFSE+ CD4+ T cells in the presence of different rations of non-OVA loaded GFP+(Cx3cr1+) i-OCLs from WT Cx3cr1GFP/+ mice. (E) FACS analysis and quantification of CFSE+ CD4+ T cells of OT-II mice cocultured in the presence of different ratios (1:0; 1:1; 1:2) between OVA-loaded Cx3cr1neg i-OCLs and Cx3cr1+ i-OCLs (non-loaded with OVA) for 5 days. *p<0.05; **p<0.01; ***p<0.001; ****p<0.0001; n.s., no significant difference.

