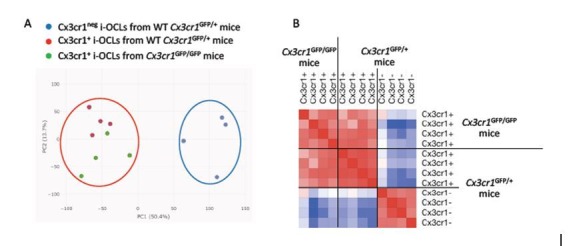
Author response image 1. Cx3cr1neg i-OCLs from Cx3cr1GFP/+ mice are distinct from Cx3cr1+ i-OCLs from deficient Cx3cr1GFP/GFP mice.

A) Principal component analysis of Cx3cr1+ from deficient Cx3cr1GFP/GFP mice (green) and Wt Cx3cr1GFP/+ mice (red) and Cx3cr1neg i-OCLs from Cx3cr1GFP/+ mice (blue). Data shows the two first components after batch correction. Each dot represents the expression profile of one sample. B) Similarity matrix analysis on the same samples.
