
Figure 6.
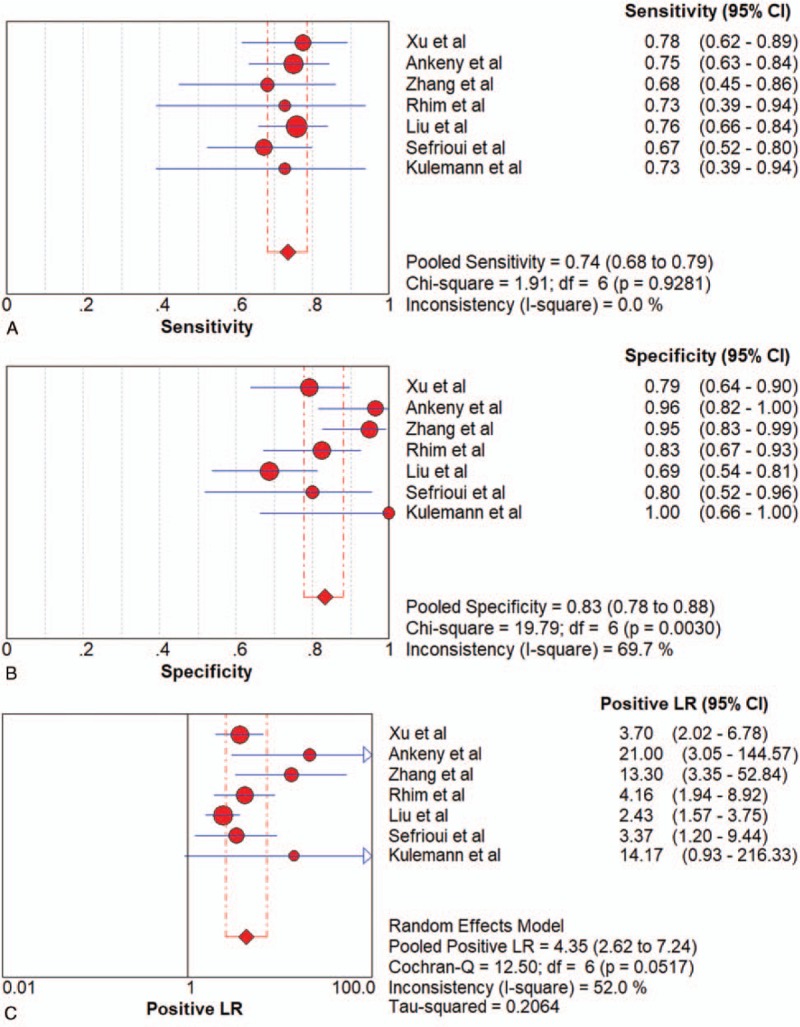
Forest plot of the diagnostic value for overall CTCs in detecting pancreatic cancer. (A) Sensitivity. (B) Specificity. (C) positive likelihood ratio. (D) negative likelihood ratio. (E) Diagnostic odds ratio. (F) SROC curve.
Official websites use .gov
A
.gov website belongs to an official
government organization in the United States.
Secure .gov websites use HTTPS
A lock (
) or https:// means you've safely
connected to the .gov website. Share sensitive
information only on official, secure websites.
Forest plot of the diagnostic value for overall CTCs in detecting pancreatic cancer. (A) Sensitivity. (B) Specificity. (C) positive likelihood ratio. (D) negative likelihood ratio. (E) Diagnostic odds ratio. (F) SROC curve.