Figure 4 (Continued).

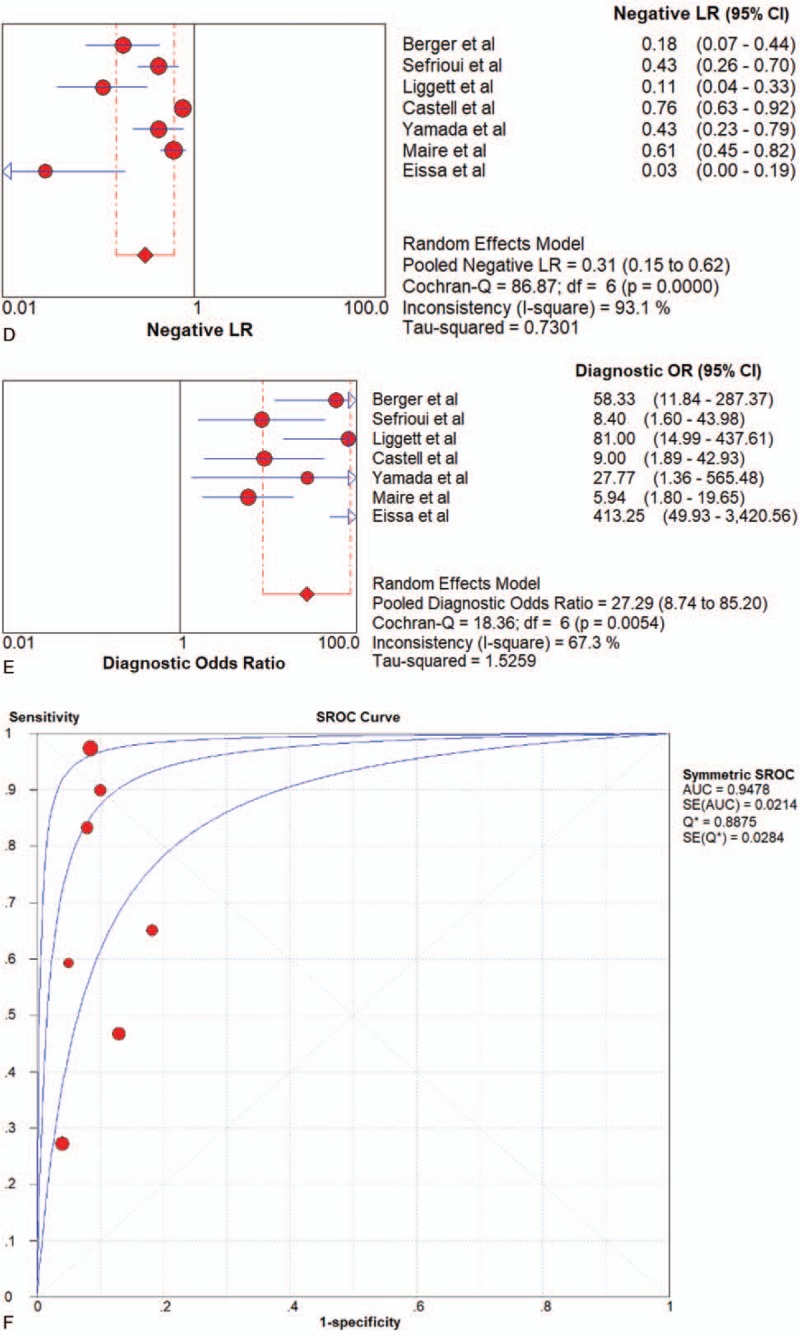
Forest plots of the diagnostic value for ctDNA in detecting pancreatic cancer. (A) Sensitivity. (B) Specificity. (C) positive likelihood ratio. (D) negative likelihood ratio. (E) Diagnostic odds ratio. (F) SROC curve.

Forest plots of the diagnostic value for ctDNA in detecting pancreatic cancer. (A) Sensitivity. (B) Specificity. (C) positive likelihood ratio. (D) negative likelihood ratio. (E) Diagnostic odds ratio. (F) SROC curve.