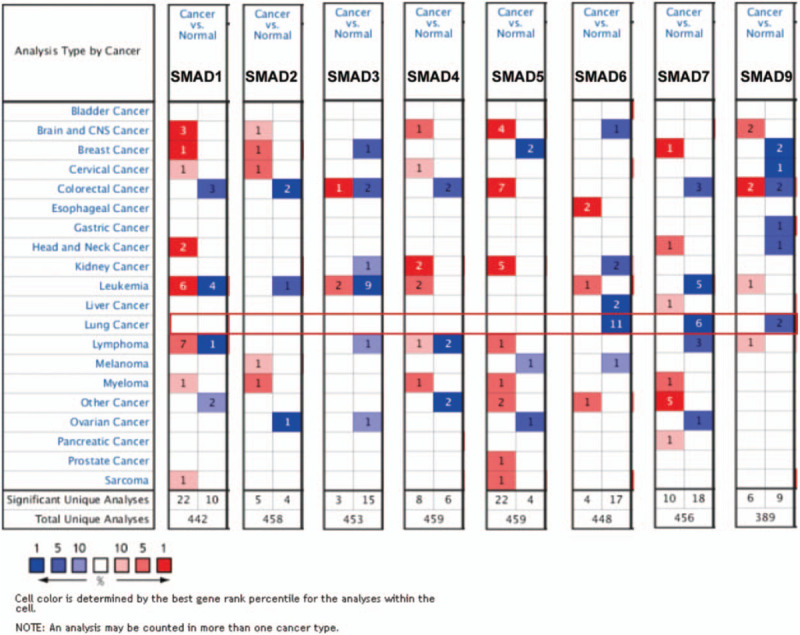
Figure 1.

The transcription levels of SMAD family members in different types of cancers (ONCOMINE). The graphic demonstrated the numbers of datasets with statistically significant mRNA over-expression (red) or down-expression (blue) of the target gene. The threshold was designed with following parameters: P value = .001; fold-change = 1.5 and data type, mRNA.
