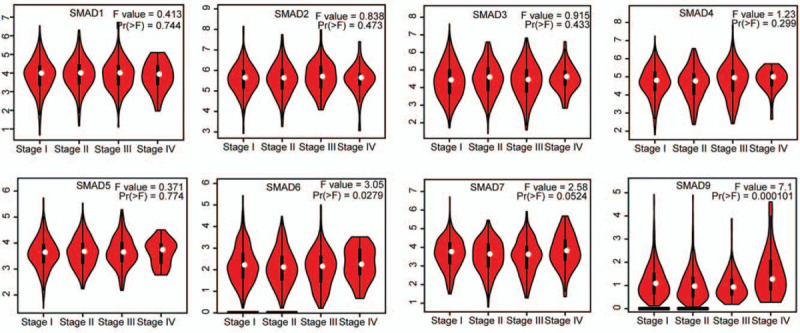
Figure 3.

The expression of SMAD family members in different tumor stage of NSCLC patients (GEPIA). Pathological stage plot derived from gene expression data in GEPIA comparing expression of a specific SMAD family member in different stage of NSCLC tissue, the P value was set up at .05.
