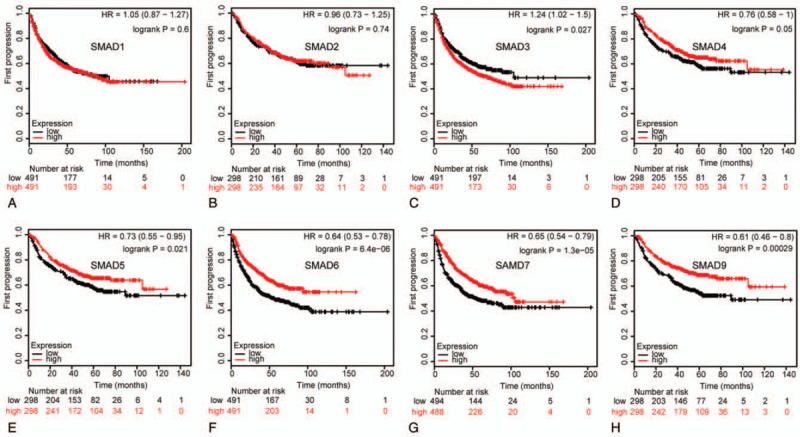
Figure 6.

Correlation of SMAD mRNA expression with FP in NSCLC patients (Kaplan-Meier plotter). FP curves of (A) SMAD1 (Affymetrix IDs: 208693_s_at). (B)SMAD2 (Affymetrix IDs: 226563_at). (C)SMAD3 (Affymetrix IDs: 218284_at). (D)SMAD4 (Affymetrix IDs: 235725_at). (E)SMAD5 (Affymetrix IDs: 225223_at). (F)SMAD6 (Affymetrix IDs: 207069_s_at). (G)SMAD7 (Affymetrix IDs: 204790_at). (H)SMAD9 (Affymetrix IDs: 227719_at). The FP survival curve comparing the patient with high (red) and low (black) SMAD family members’ expression in NSCLC were plotted from Kaplan-Meier plotter database as the threshold of P value <.05, respectively.
