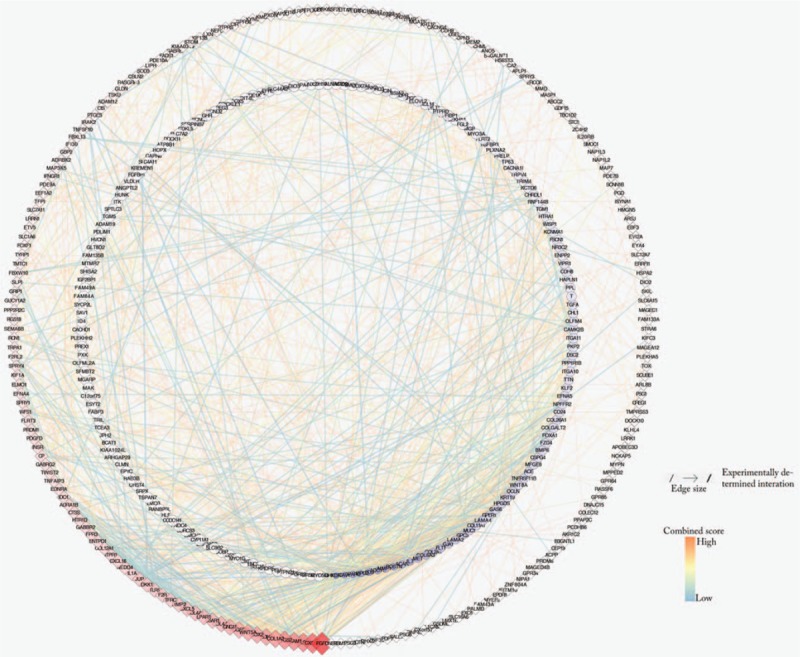
Figure 7.

All DEGs PPI networks are visualized in Cytoscape. The red diamonds represent the up-regulated DEGs and the blue balls represent the down-regulated DEGs. As the degree score increases, the color of the ball gradually changes from light blue to dark blue, and their size gradually becomes smaller. The color of the diamond gradually changes from light red to deep red, and their size gradually increases.
