Figure 2.

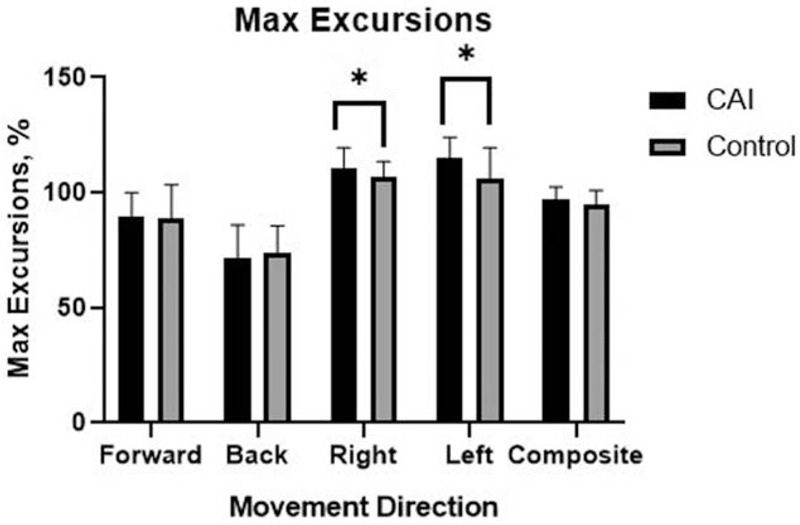
Bar graph of max excursions representing the average ± standard deviation in each group. ∗Different from the control group (P < .05).

Bar graph of max excursions representing the average ± standard deviation in each group. ∗Different from the control group (P < .05).