Figure 5.

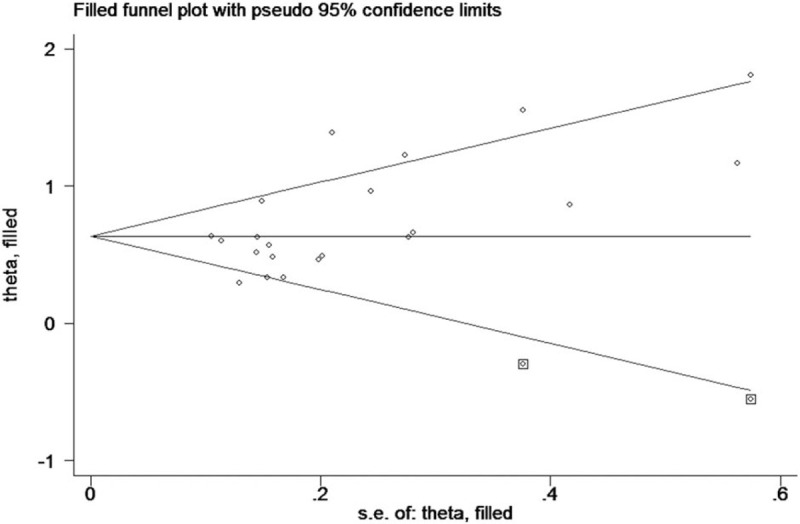
Funnel plots of trim and fill analysis of the relationship between a high CAR and OS. CAR = C-reactive protein to albumin ratio, OS=overall survival.

Funnel plots of trim and fill analysis of the relationship between a high CAR and OS. CAR = C-reactive protein to albumin ratio, OS=overall survival.