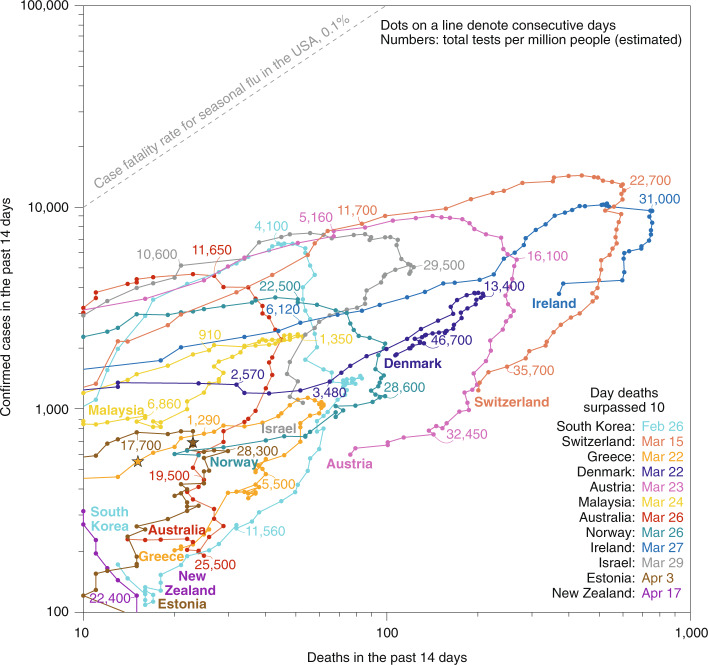
Fig. 1. Selected countries with smaller COVID-19 outbreaks.
Reported confirmed cases and deaths (14-day rolling numbers) for countries that acted earlier and tested more widely (Singapore and Taiwan, which have never reached ten deaths within any two-week period, are outside the graph’s range). For some of them, geographical insularity may have also helped slow the spread. Early large-scale serology studies suggest that the actual number of infections is 10–20 times the number of reported cases. After turning a corner, bringing cases and deaths down takes many more weeks that it took for cases and deaths to reach a peak. Infection fatality rates, which depend on demographics, cultural factors, the capacity and quality of healthcare systems, public health measures and mitigation measures, are estimated to be 0.5–1% — a multiple of that for seasonal flu in the United States (0.1%). Data updated 11 May 2020. Individual data points can be affected by reporting errors and delays, and by location-specific definitions (and changes to them) for confirmed cases and deaths. Data sources: European Center for Disease Control and Prevention13 (cases and deaths); Our World in Data6 (tests). Additional updated graphs are available14.

