
Figure 10.
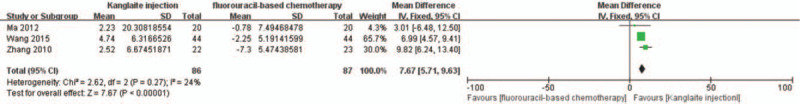
The analysis of CD3+ between 2 groups. Forest plot of the comparison of CD3+ levels between the experimental and control group. Control group, chemotherapy alone group; Experimental group, Kanglaite injection and fluorouracil-based chemotherapy combined group. The fixed-effects model was used.