Figure 1.

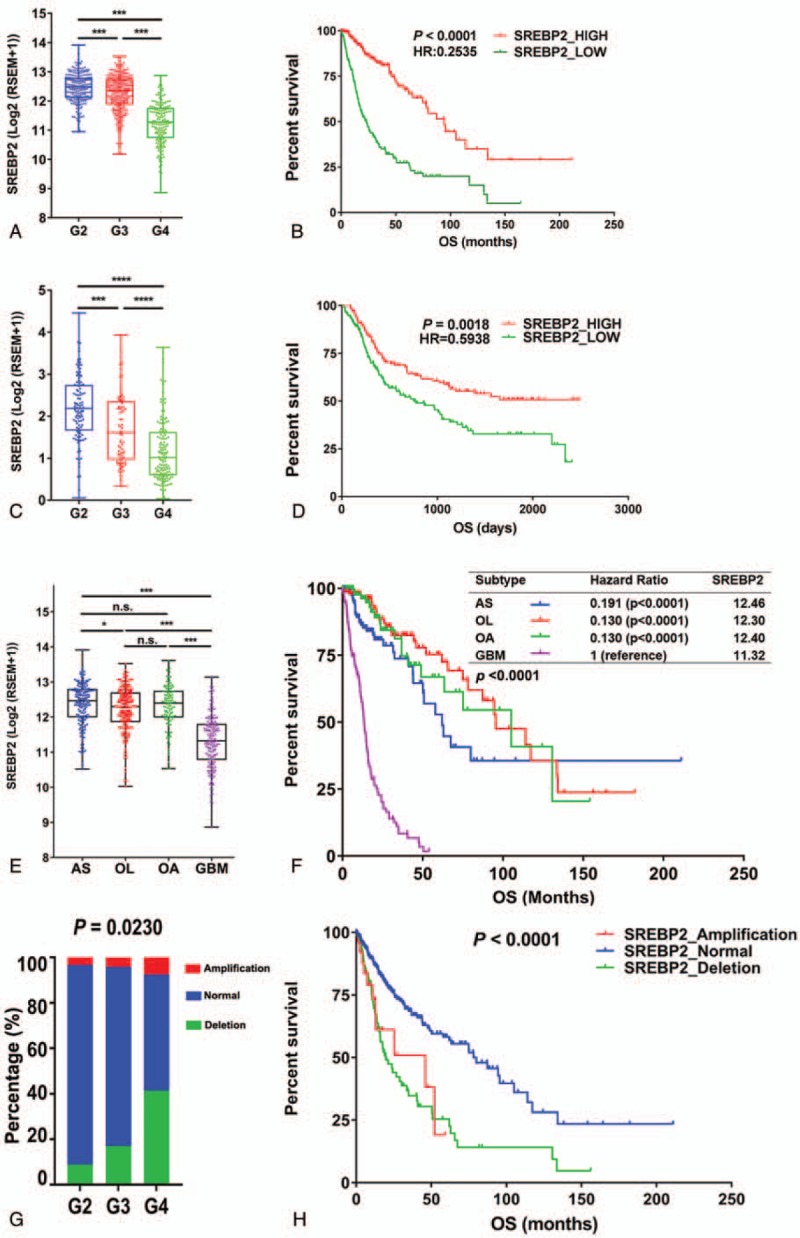
Expression of SREBP2 is associated with overall survival of diffuse glioma cases in both TCGA and CGGA datasets. (A) mRNA expression of SREBP2 in gliomas of WHO grade G2, G3, and G4 (GBM) in TCGA dataset. Grade 2, n = 216; Grade 3, n = 241; Grade 4, n = 160, Student t test. (B) Kaplan–Meier survival curves of SREBP2 high/low expression groups in diffuse glioma patients from the TCGA dataset. (C) mRNA expression of SREBP2 in gliomas of WHO grade G2, G3, and G4 (GBM) in the CGGA dataset. Grade 2, n = 105; Grade 3, n = 67; Grade 4, n = 138, Student t test. (D) Kaplan–Meier survival curves of SREBP2 high/low expression groups in diffuse glioma patients from the CCGA dataset. (E) mRNA expression of SREBP2 in different glioma subtypes in the TCGA dataset. Astrocytoma (AS), n = 169, oligodendroglioma (OL), n = 174, oligoastrocytoma (OA), n = 114, GBM, n = 160. Student t test. The groups were divided according to the median level of SREBP2 mRNA expression. (F) Kaplan–Meier survival curves of different subtypes of glioma. Inset table shows hazard ratio (HR) of the comparison of each subtype with GBM, and the Log2 median expression level of SREBP2 (Table in panel F). (G) of SREBP2 in LGG and GBM. Percentage of Copy number variation (CNV) events of SREBP2 in LGGs and GBMs. SREBP2 amplification, n = 35; SREBP2 normal, n = 458; SREBP2 deletion, n = 124. (H) Kaplan–Meier survival curves of patients with different CNV events. HR was calculated by the ratio of overall survival (OS) of each subtype group vs GBM over the study time period. Ticks represent censored values. AS, astrocytoma, OL, oligodendroglioma, OA, oligoastrocytoma. ∗, P < .05; ∗∗, P < .01; ∗∗∗, P < .001; ∗∗∗∗, P < .0001; n.s., not significant.
