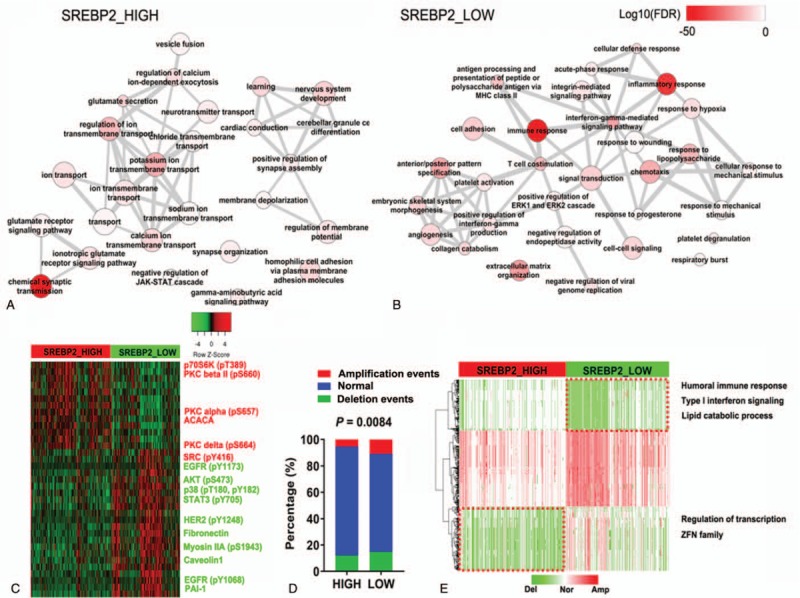
Figure 5.

Distinct genetic profiling of SREBP2 high and low expression groups. (A, B) Biological process (BP) terms involved in SREBP2 high (a) or low (B) expression group. (C) Protein expression and phosphorylation (RPPA) in SREBP2 high or low expression groups n = 331. (D) Percentage of different CNV events in SREBP2 high or low expression groups. (E) Frequent amplification or deletion events in SREBP2 high or low expression groups.
