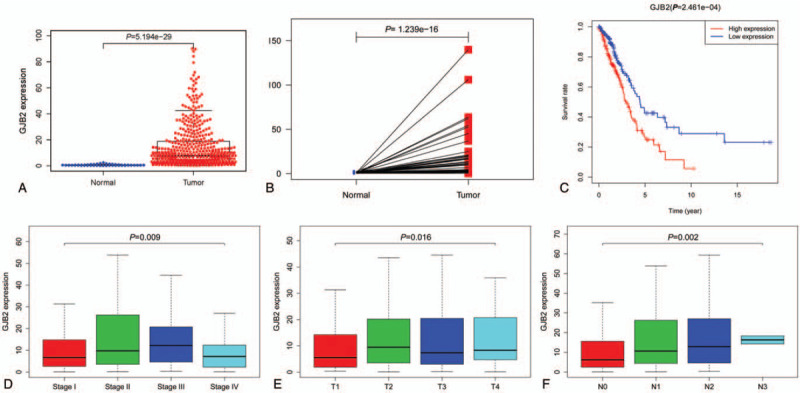
Figure 1.

(A) The scatter plot showed the difference of Cx26 expression between normal and tumor samples (P < .01); (B) paired plot to demonstrated the Cx26 expression between normal and tumor from the same patients and the results was significant difference (P < .01); (C) Overall survival (OS) analysis demonstrated that LUAD with Cx26 -high had a more terrible prognosis than that with Cx26 -low (P < .01); (D-F) The expression of Cx26 correlated significantly with the patient clinical stage, T-classification and N-classification (P < .05).
