. 2020 Apr 24;99(17):e16406. doi: 10.1097/MD.0000000000016406
Copyright © 2020 the Author(s). Published by Wolters Kluwer Health, Inc.
This is an open access article distributed under the terms of the Creative Commons Attribution-Non Commercial-No Derivatives License 4.0 (CCBY-NC-ND), where it is permissible to download and share the work provided it is properly cited. The work cannot be changed in any way or used commercially without permission from the journal. http://creativecommons.org/licenses/by-nc-nd/4.0
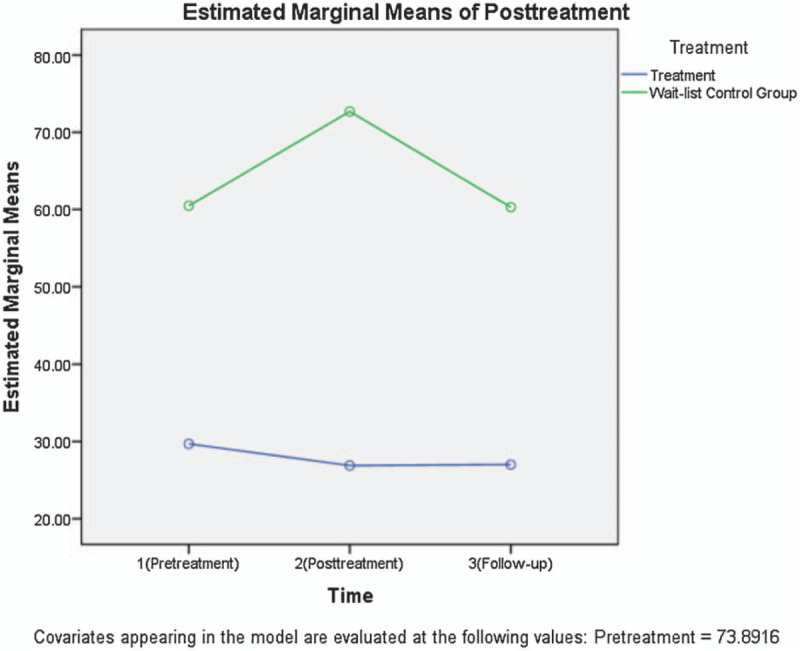
Figure 2.

Graph of time × group interaction effect using Generalized Test Anxiety Inventory.
