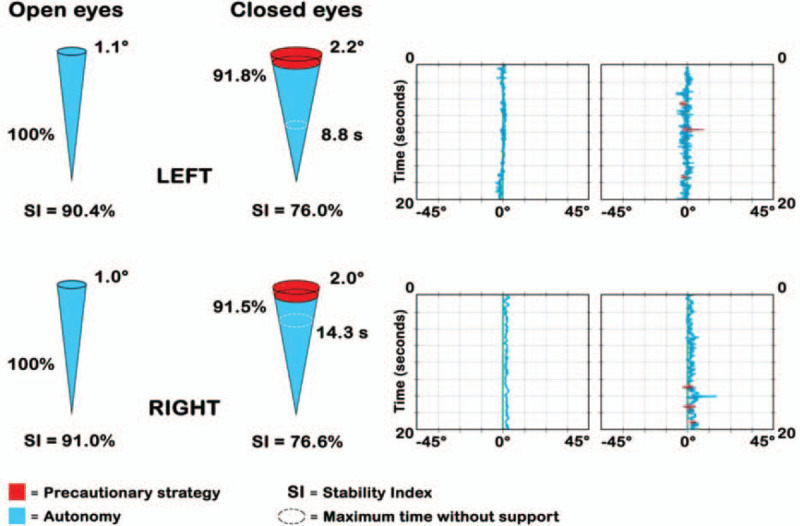
Figure 3.

Graphic evaluation of the Static Stability Index (SSI). SSI is represented with cones (at the left), measuring its amplitude and using a color code to mean (1) BLU autonomy, i.e., the component without support and (2) RED precaution strategy. The time without support is also registered. RED and BLU are also expressed in % of total time (if strategy is < 10% → it is not significant). Clusters (at the right) represent oscillations of the body vs the x and y axes. In this test the subject does not receive postural feedback and every trial lasts 20 seconds.
