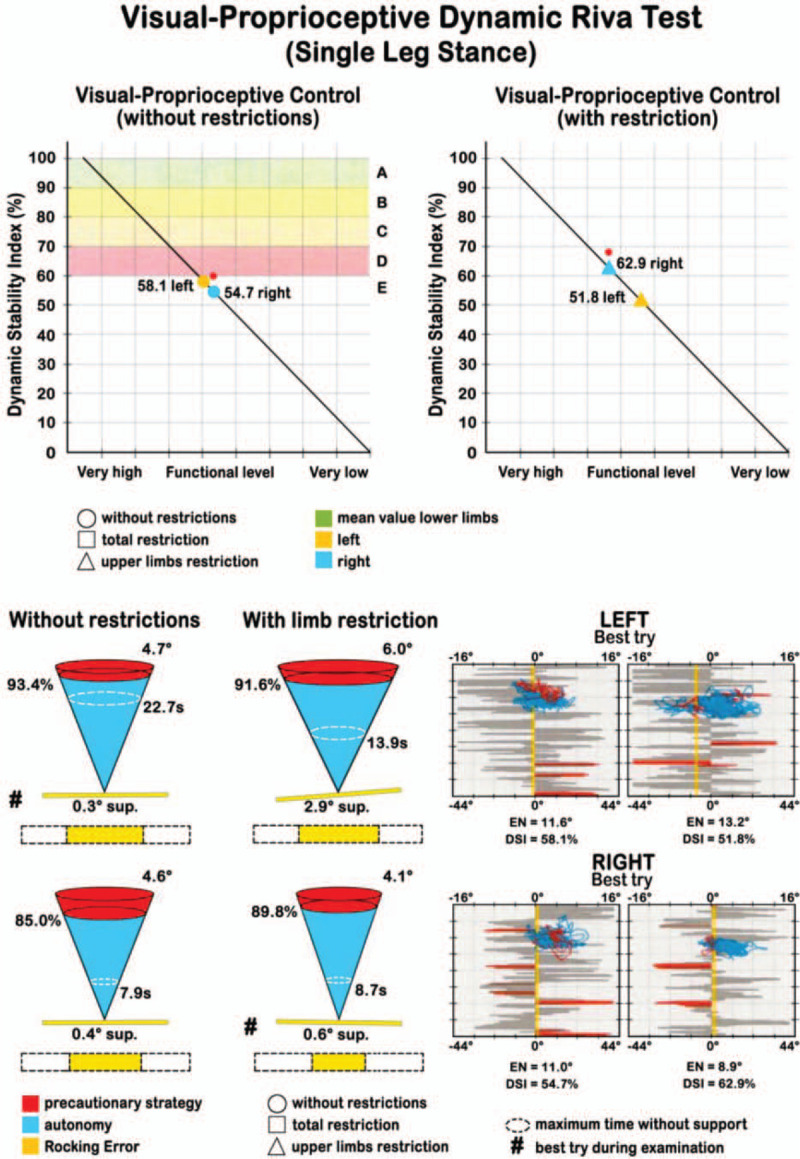
Figure 5.

Graphic evaluation of the Dynamic Stability Index (DSI). Values were expressed in % with a color code (red, yellow and green): the lower the DSI, the higher the probability of re-injury in the future. Other information derived by the representation of the DSI as cones, similarly to the static test.
