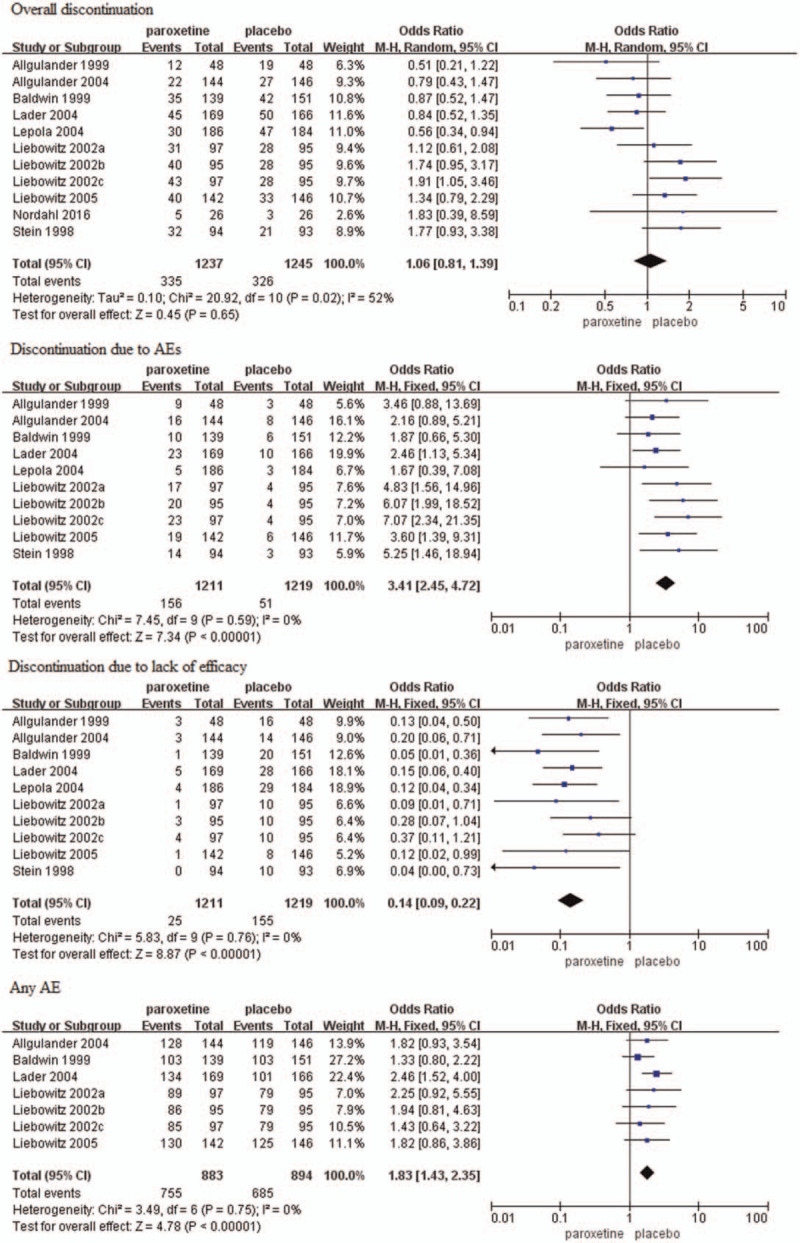
Figure 8.

Forest plots of rates of overall discontinuation, discontinuation due to AEs, discontinuation due to lack of efficacy, and the incidence of any AE. AE = adverse event, CI = confidence interval.

Forest plots of rates of overall discontinuation, discontinuation due to AEs, discontinuation due to lack of efficacy, and the incidence of any AE. AE = adverse event, CI = confidence interval.