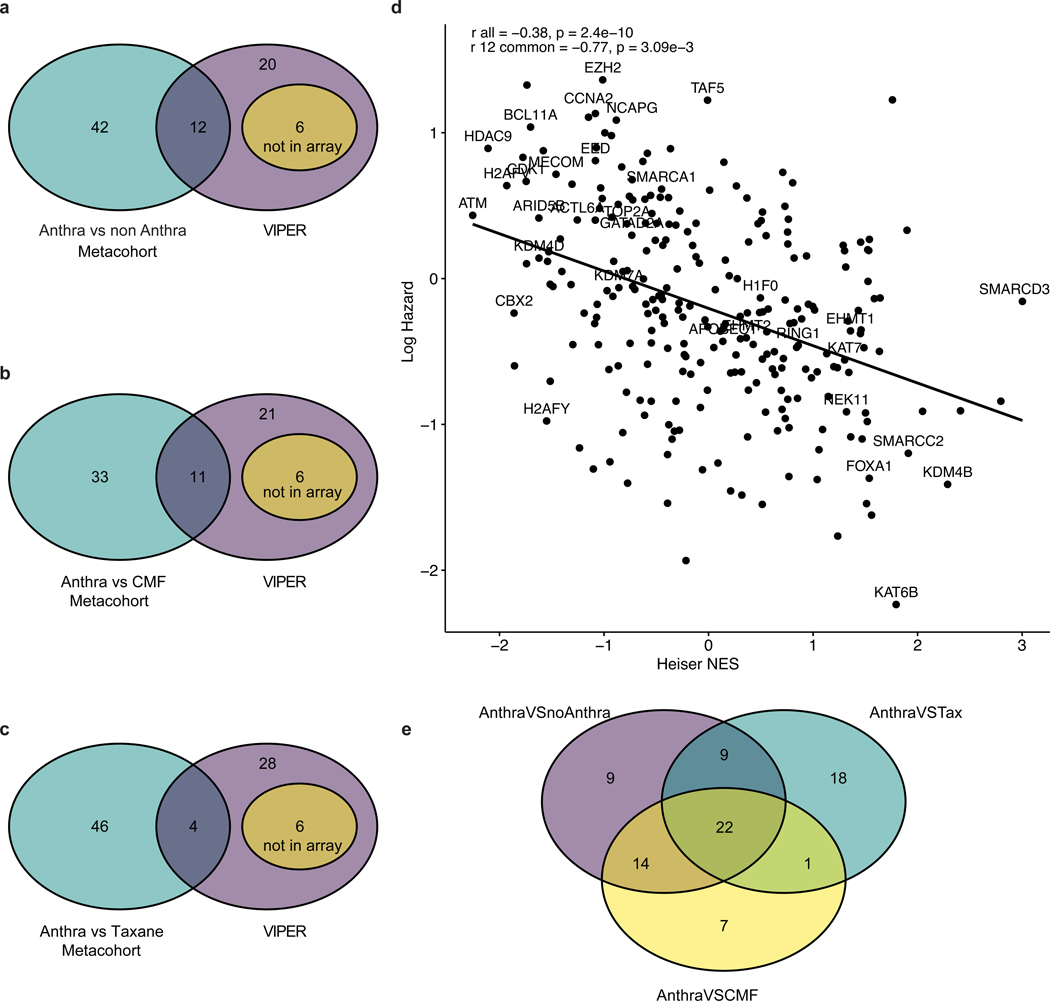
Extended Data Fig. 7: Correlation between clinical and in silico analysis.
Panels A, B, C: Venn diagrams illustrating the overlap between CRGs associated with anthracycline response in vitro based on VIPER (38 genes) and in vivo based on the Cox Proportional Hazard model in the breast cancer patient metacohort for different treatment regimens, as indicated. Panel D: Correlation between Heiser microarray dataset Normalized Enriched Score (NES) for each CRG from VIPER and the log hazard ratio for overall survival from the anthra vs non-anthra metacohort (N=760 individual samples). Labels represents the CRGs significant in VIPER. Here, r all represents the Pearson correlation across all CRGs and r 12 represents the Pearson correlation across the 12 common CRGs across clinical and VIPER analysis. Panel E: Significant CRGs across different treatment regimens. Significant CRGs across the anthracycline versus non-anthracycline, anthracycline versus CMF, and anthracycline versus taxanes comparisons are indicated. A total of 22 genes were significant across the 3 cohorts.

