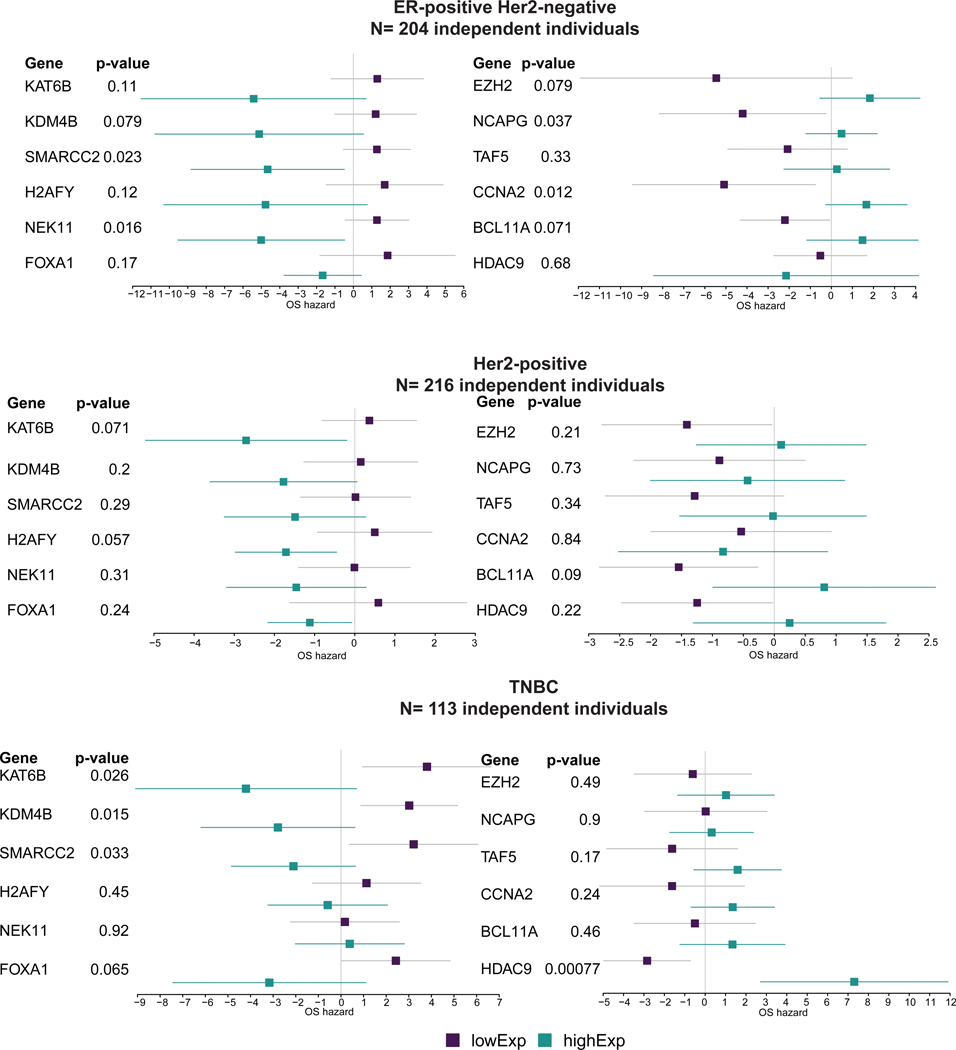
Extended Data Fig. 8: Anthracycline versus non-anthracycline comparisons by clinical subgroups.
Forest plots illustrate the difference in hazards of death (overall survival) among patients treated with anthracyclines versus those who were not treated with anthracyclines from the metacohort across the three clinical subgroups, namely ER+/Her2-, Her2+ and ER-/Her2- (triple-negative, TNBC) patients. P-values indicate the Cox Proportional Hazard interaction model among the two conditions and the expression of the gene, adjusted by age, size, lymph node positive, ER, PR and Her2 status (excluding ER and PR in ER+, Her2 in Her2+ and ER, PR and Her2 in TNBC). The forest plots show the log-2 hazard ratios (boxes) and error bars represent 95% confidence intervals.

