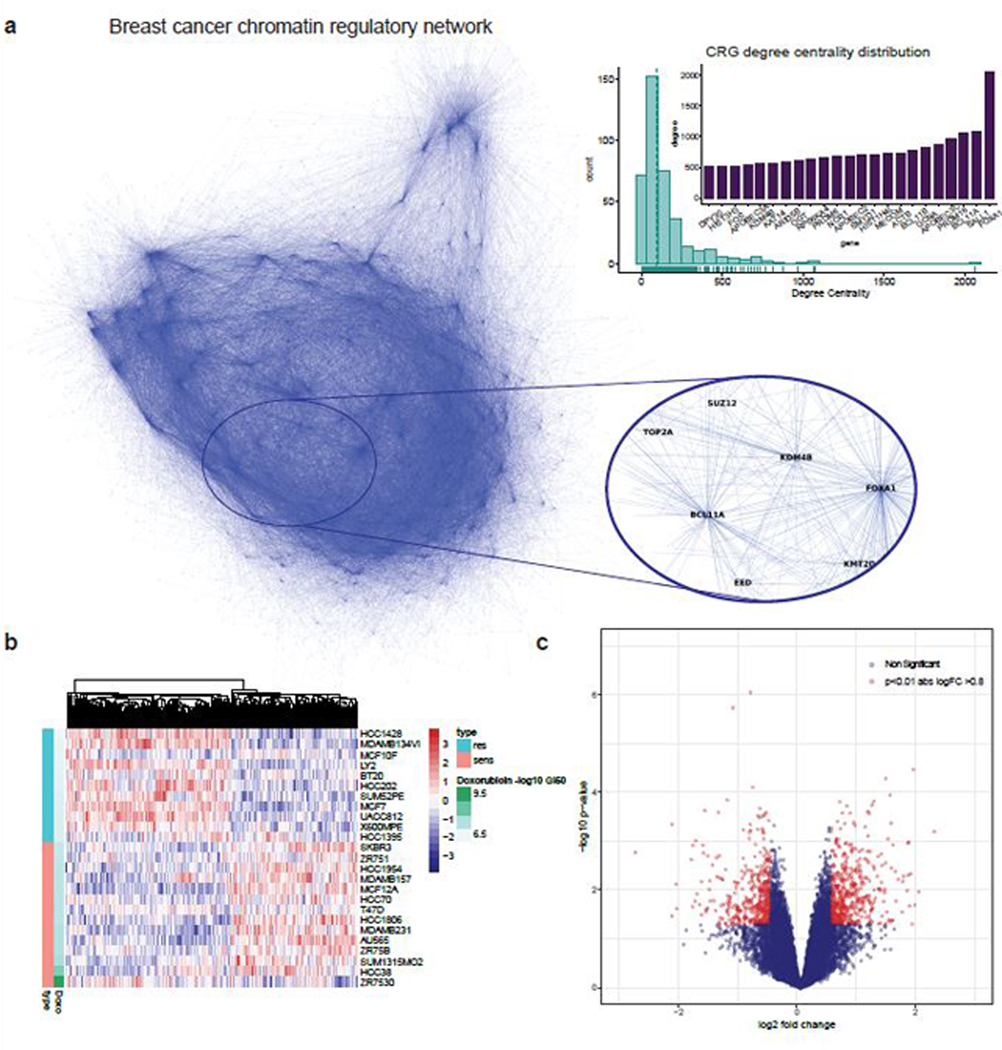
Extended Data Fig. 2: Breast cancer chromatin regulatory network and doxorubicin response signature.
Panel A: Derivation of a breast cancer chromatin regulatory network: A breast cancer chromatin regulatory network was derived from TCGA RNA-seq data using the ARACNE algorithm (Methods). The inset panel shows a region mapping to chromatin regulatory genes (CRGs) with high degree centrality. Each hub of the network is a CRG, while the terminal nodes correspond to their target genes. The histogram and barplot show the degree centrality for all CRGs, where two of the largest network hubs correspond to FOXA1, KDM4B and BCL11A. Panel B: Doxorubicin signature in breast cancer cell lines from Heiser microarray dataset (N=46 independent cell lines). Heatmap of gene expression profiles among resistant (1/3) and sensitive (1/3) breast cancer cell lines where cell lines are sorted by GI50. Panel C: Volcano plot of genes differentially expressed (moderate T-statistic from limma) between sensitive versus resistant cell lines.

