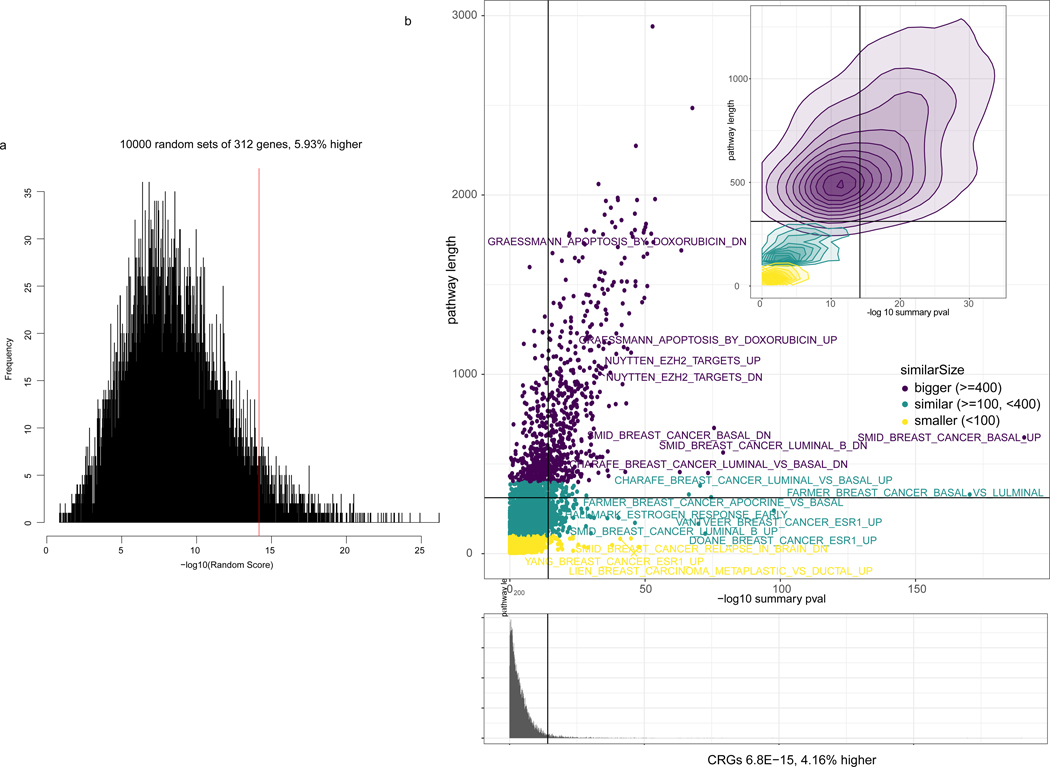
Extended Data Fig. 5: Enrichment of CRGs with response.
Enrichment of CRGs (summary p-value 6.8E-15, z-transform from survcomp package) with genes associated with anthracycline response. Panel A: 10,000 random signatures of size 312 association with outcome. CRGs are among the 6% (5.93%) highest associated. Panel B: MSigDB signatures associated with outcome. CRGs are among the 4.16% highest associatied. Colors represents the size of the signature. Summary p-values from the anthracycline vs non anthracycline cohort (N=760 individuals) Cox Proportional Hazards model of the interaction between drug and gene expression adjusted by clinical covariates as defined in Methods.

