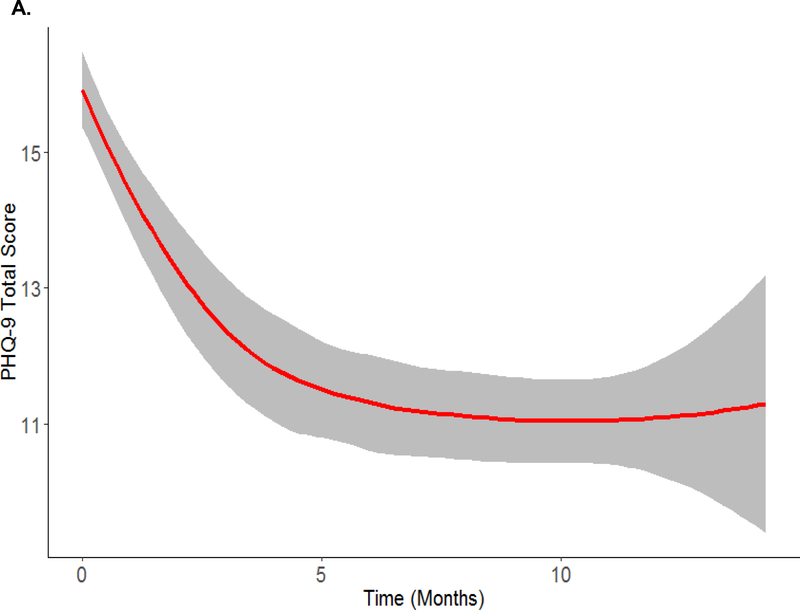
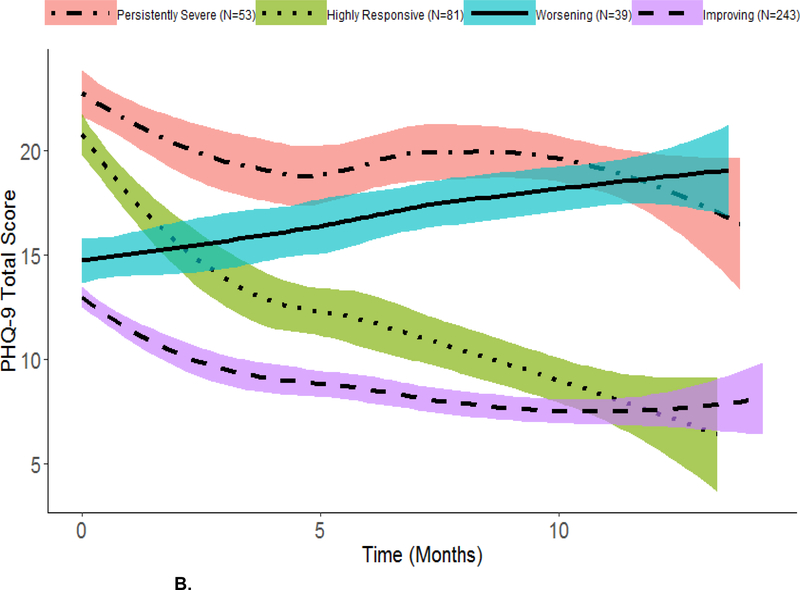
Figure 2. Overall sample (panel A) and average within-class trajectories for the four-class growth model based on most likely latent class membership clustering (panel B) using local regression smoothing.
A. Overall Trajectory (N = 416)
B. Within-Class Trajectories
Shaded region in each plot represents a 95% Confidence Interval. Individuals were classified into most likely class membership using the mixture model in Figure 1 under the assumption of linearity. Description of the within-class trajectories subgroups was done under no assumption of linearity.


