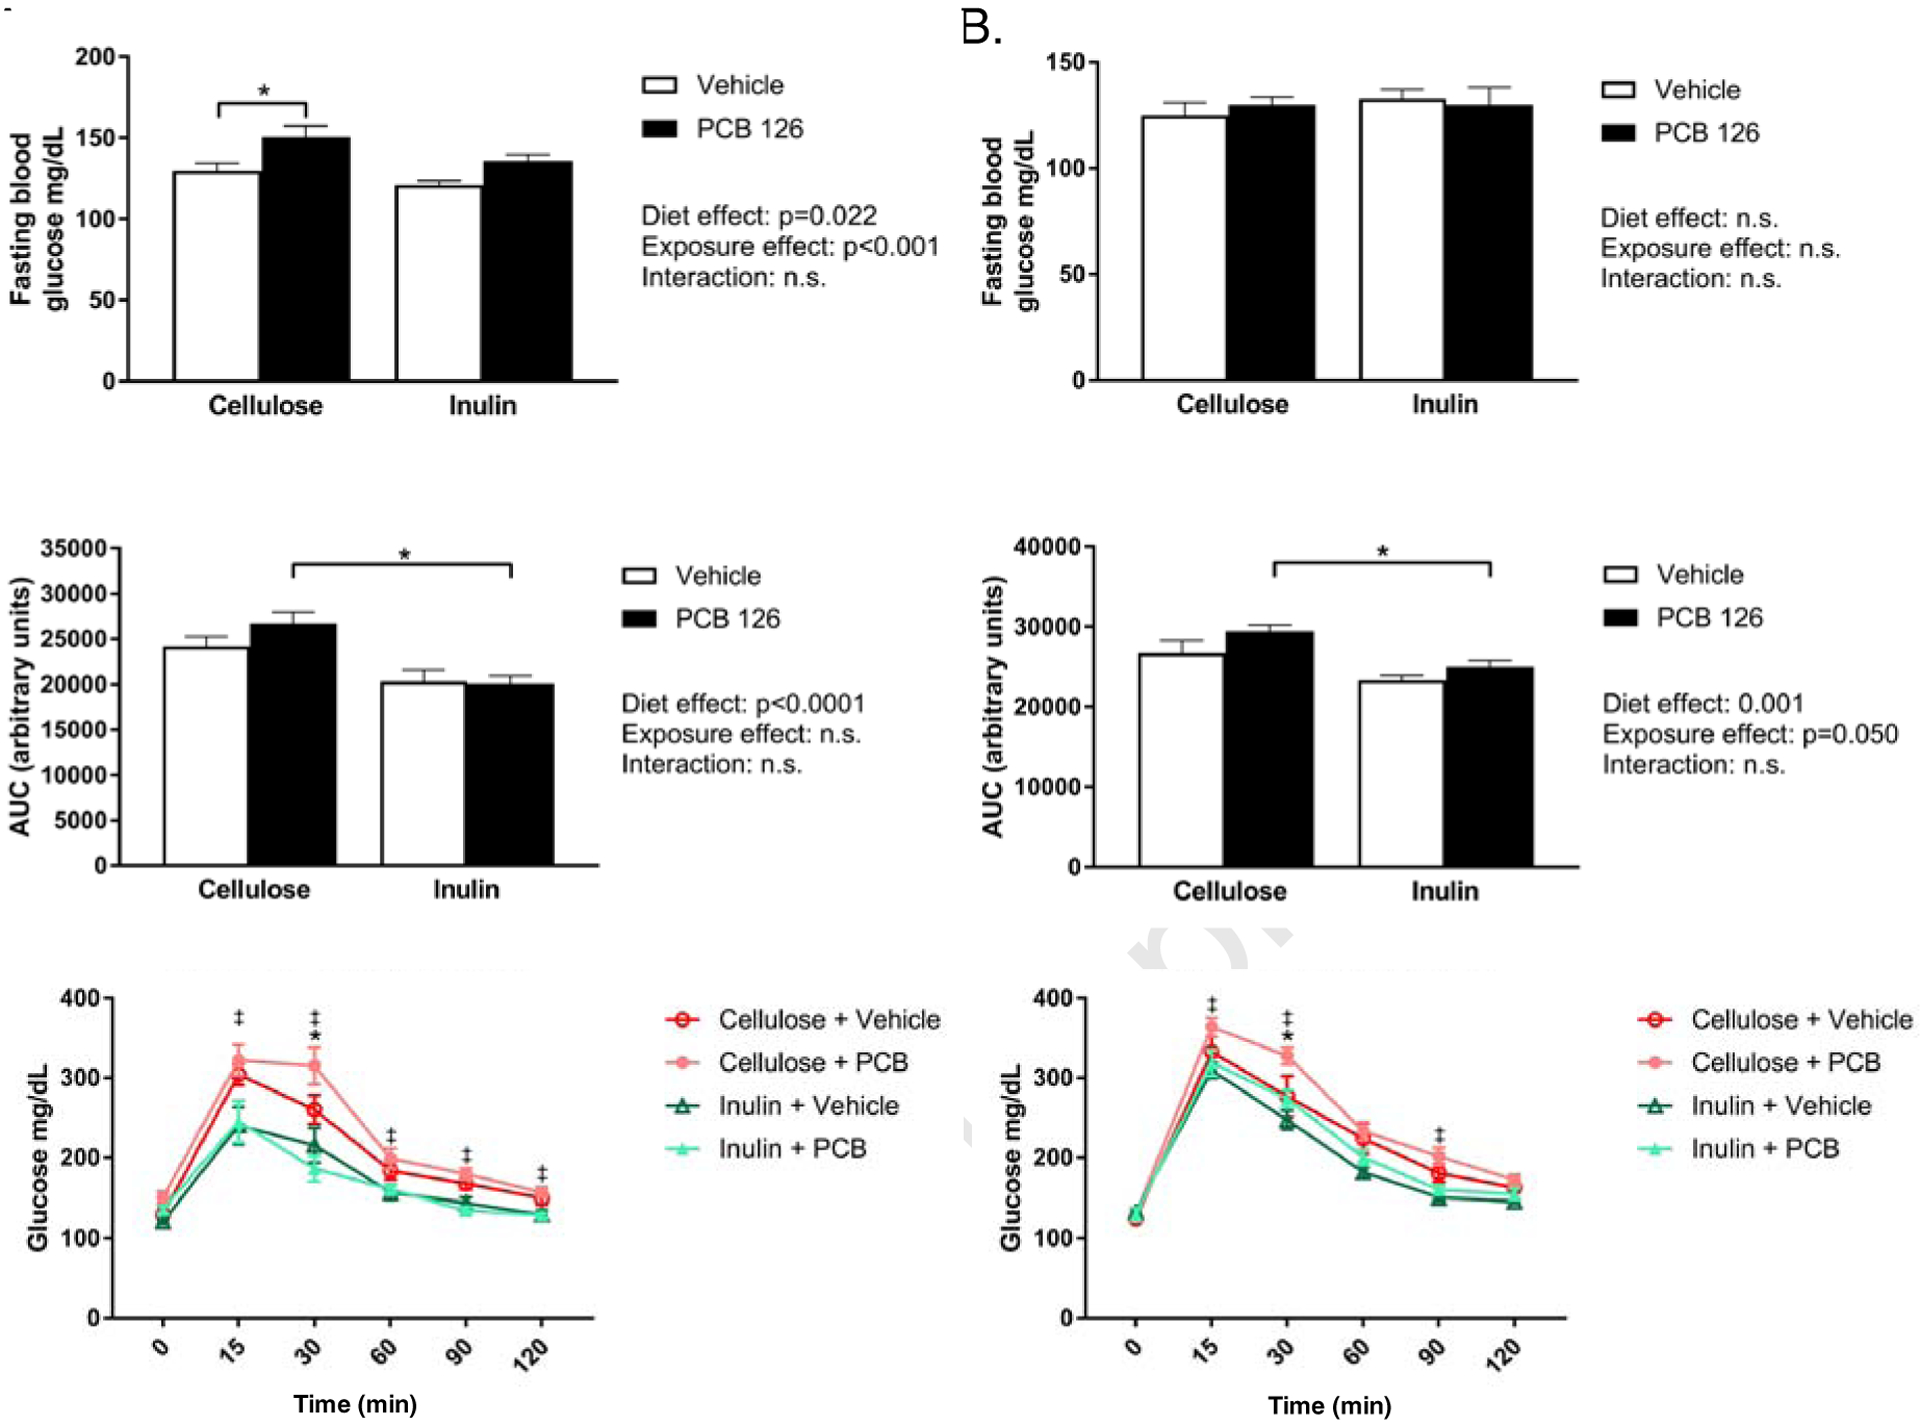
Figure 2. Inulin attenuates PCB-disruption in glucose tolerance.

Male Ldlr−/− mice were fed an atherogenic diet containing 8% cellulose or 8% inulin for 12 weeks and exposed to PCB 126 (1μmol/kg) or vehicle at weeks 2 and 4. A. Fasting blood glucose and glucose tolerance testing at week 5. PCB exposure increased fasting blood glucose levels in cellulose fed mice and not in inulin fed mice. Cellulose fed mice exposed to PCBs displayed a greater area under the curve (AUC) compared to exposed inulin fed mice. B. Fasting blood glucose and glucose tolerance testing at week 8. No differences were observed in fasting blood glucose. The effects of PCBs and diet on AUC remained significant at 8 weeks. Data are presented as mean ± S.E.M (n=10 per group). Statistical significance is denoted by * (p<0.05). For glucose curves, ‡ indicates a significant difference between “Cellulose + PCB” and “Inulin + PCB” and * indicates a significant difference between “Cellulose + Vehicle” and “Cellulose + PCB”.
