Fig. 3.
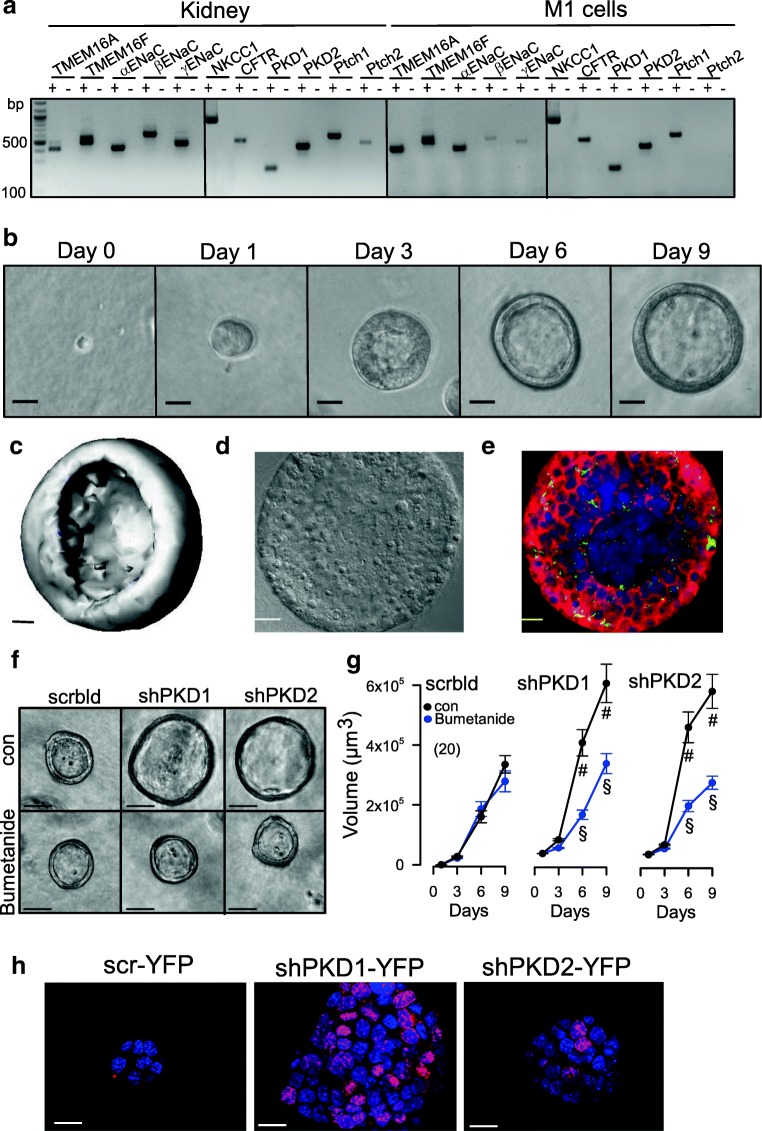
M1 renal organoid and cyst model. a RT-PCR analysis of mRNA expression of ion channels and receptors in mouse kidney and M1 collecting duct cells: TMEM16A, TMEM16F, αβγ-ENaC, NKCC1, PKD1, PKD2, and the receptors patched 1,2 (Ptch1,2). Similar expression patterns were found in mouse kidney and M1 cells. ± indicate presence/absence of reverse transcriptase. b Time-dependent development of renal organoids in Matrigel (n = 20). Bars = 20 μm. c Reconstructed 3D image from a renal M1 organoid with a view inside the organoid. Bar = 20 μm. d, e Differential interference contrast (DIC) image and immunocytochemistry of a cross-section of an organoid. Green, primary cilia; red, CFTR; blue, DAPI. Bars = 20 μm. f, g Increase of the volume of M1 organoids by shRNA-knockdown of PKD1 or PKD2. The presence of the NKCC1-inhibitor bumetanide (100 μM) did not change the size of control organoids (treated with scrambled RNA; scrbld), but inhibited further enlargement by shRNA-knockdown of PKD1 or PKD2, indicating fluid secretion upon knockdown of PKD1,2. Bars = 50 μm. h Increase of proliferative activity in shPKD1/shPKD2 organoids as indicated by Ki-67 staining. Bars = 20 μm. Mean ± SEM (number of organoids measured). #Significant difference when compared with scrambled (p < 0.05; unpaired t test). §Significant difference when compared to absence of bumetanide (p < 0.05; unpaired t test)

