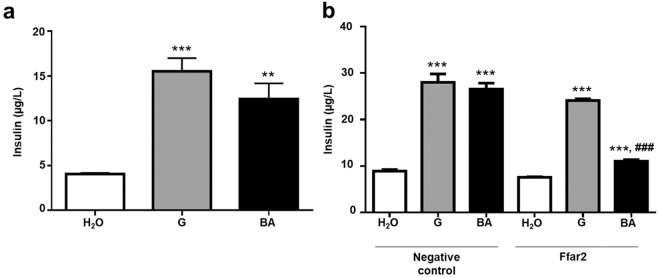
Figure 2.
Effects of butyric acid on insulin secretion from Min6 cells. (a) Levels of insulin secretion from Min6 cells after treatments with water (H2O), 100 µmol/L glucose (G), and 100 µmol/L butyric acid (BA) for 24 h were measured by ELISA. (b) Min6 cells pre-treated with Ffar2 or negative control siRNAs before incubation with water, glucose, and butyric acid for 24 h. The level (µg/L) of insulin was detected using a mouse insulin ELISA kit. Data are the mean ± SD from 3 independent experiments. **p < 0.01; ***p < 0.001 vs water treatment and #p < 0.05; ###p < 0.001 vs glucose treatment.

