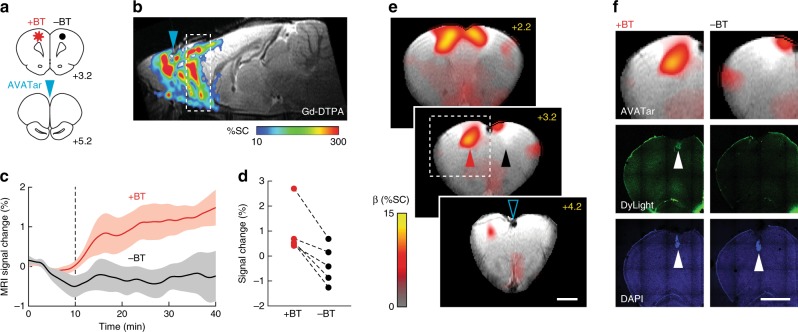
Fig. 4. In vivo molecular imaging with BT-AVATar.
a Brain atlas57 sections (bregma coordinates noted) showing positions of test (+BT, red) and control (−BT, black) cell implants and intra-CSF AVATar infusion for in vivo mapping experiments. b Wide-field probe delivery illustrated using Gd-DTPA infused at the AVATar infusion position (blue arrowhead). Color scale illustrates signal changes (%SC) produced by the contrast agent. c Signal change over time near test (+BT, red) and control (−BT, black) cells. Dashed line indicates start of AVATar infusion. Shading denotes SEM of n = 5. d Signal enhancements in individual animals at +BT (red) and –BT (black) sites. e Map of regression coefficients (β, in units of %SC) illustrating responses near +BT cell implant locations (red arrowhead) but not –BT controls (black arrowhead). BT-AVATar was infused 1 mm anterior to the open blue arrowhead. Displayed brain slices correspond to the dashed region in b. Scale bar = 2 mm. f Comparison of MRI results with histology shows overlap of BT-AVATar signal with position of test implants (left images) but not control implants (right images). Top row: closeup of the dashed region in e (left), containing +BT cells, juxtaposed with the symmetric region containing –BT cells (right). Middle row: selective activation of BT-AVATar by biotinylated cells is confirmed by visualization of biotinylated cells (left, arrowhead) but not unbiotinylated cells (right) following infusion of fluorescent BT-AVATar formulated with DyLight-labeled SA. Bottom row: visualization of both test and control xenografts (arrowheads) by DAPI staining. Scale bar = 2 mm.

