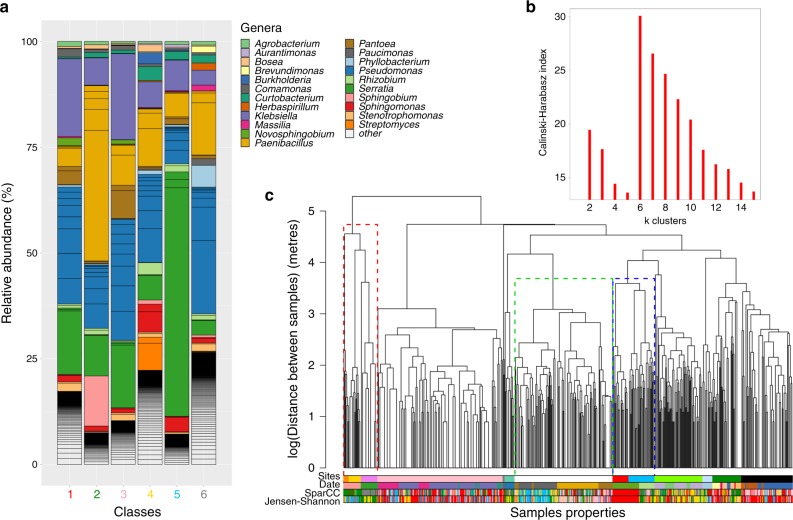
Fig. 2. Description of community classes and how they relate to the sampling sites.
a Genus frequencies in each of the six community classes found after unsupervised clustering of the communities using DSparCC. Only the 15 most abundant genera in each community class are shown, with the remainder classified as others. b Calisnki–Harabasz index versus the number of final clusters in the classification, showing a maximum at six classes. c The dendrogram represents the clustering of the samples (leaves in the tree) according to their spatial distances. The coloured bars represent membership of each sample to different classifications (from top to bottom): the sites, the day of sampling collection (Date) and the classes found using either DSparCC and DJSD. Dotted rectangles in the dendrogram indicate examples of: (green) locations where one site was sampled on different days; (blue) two sites sampled on the same day: (red) a mix of both situations. It is apparent that the date is a better match to the community classes than the site, which is confirmed with a comparison between the classifications (Supplementary Table 3).

