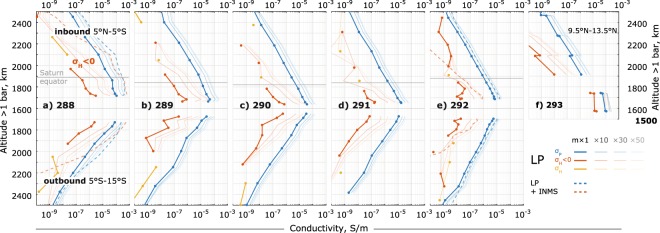
Figure 3.
Minimum estimates of the Pedersen (blue) and Hall (red <0 and yellow >0) conductivities for orbits 288–292 (a–e) and the Final Plunge (f). The plots are in altitude, along inbound (top) and outbound (bottom) trajectories, gray horizontal lines show crossings of Saturn’s equatorial plane. See also legend in panel a. The outbound trajectories have reversed altitude axis for easier comparison with inbound (and roughly representing the orbits as shown in Fig. 1a). Solid lines are derived from RPWS/LP ion data alone. Dashed lines (a 288 and e 292 only) also have INMS and densities, excluding the regions with densities exceeding electron densities17. The fainter lines show the profiles for mass factors 10, 30 and 50, for reference. Errors on the Pedersen conductivity are smaller than the markers. Errors on the Hall conductivities are 2 orders of magnitude larger than the values and are omitted here to avoid clutter (see the Methods section for details).

