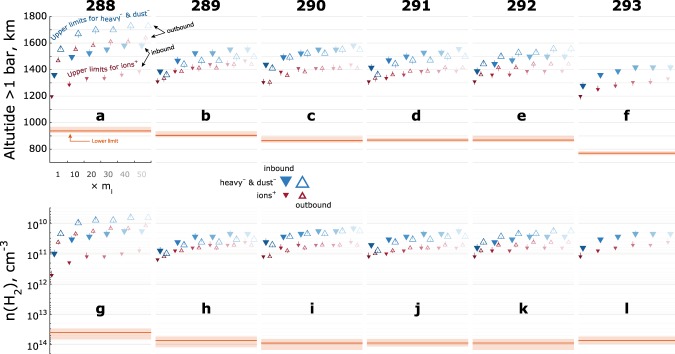
Figure 7.
Estimates of the ionospheric conductive (dynamo) region limits for orbits 288–293, plotted in altitude above 1 bar (a–f) and number density (g–l). Inbound markers are filled, outbound markers are empty. The larger blue markers show the negative ions and dust grains, the smaller red markers show the positive ions. Brightest colours show the minimum estimate (for the masses derived from RPWS/LP, see the Methods section). Colour gradient shows mass dependency, which is largely due to a lower gyrofrequency of the heavier particles. Red shade shows combined standard error for the lower limit.

