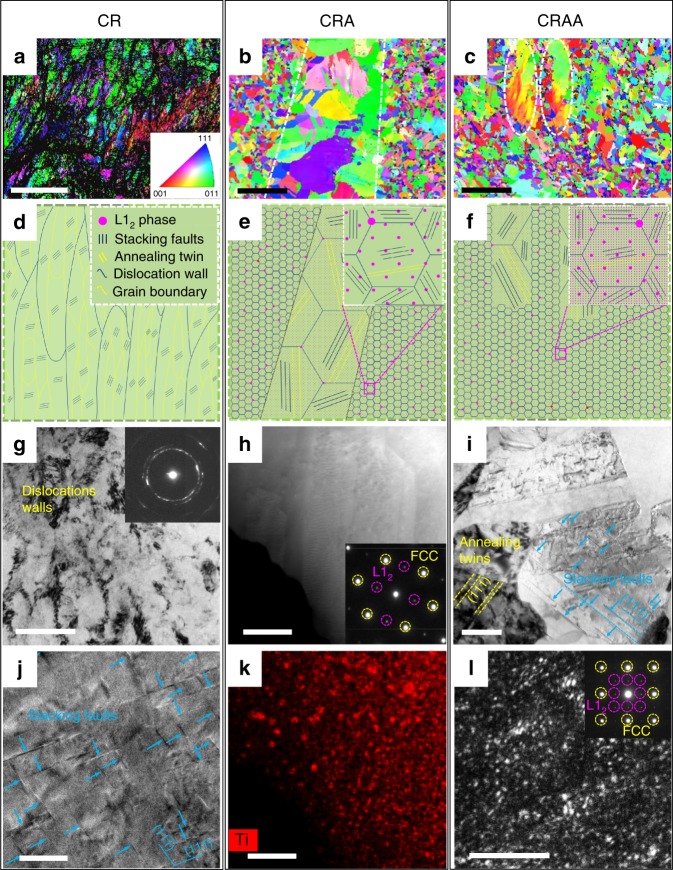
Fig. 2. The microstructures of alloys subject to the CR, CRA and CRAA processes.
a, d, g, j For CR; b, e, h, k for CRA; and c, f, i, l for CRAA. a–c Normal direction EBSD inverse pole figure maps of alloys subject to CR, CRA, and CRAA, respectively. b, c Reveal non-uniform recrystallized microstructure resulting from the strain gradient during CR. The regions outlined by white dashed lines are coarse recrystallized grains (10∼30 μm), whereas other regions are fine recrystallized grains (0.5∼2 μm). d, e, f Schematic diagrams illustrating the microstructure evolution. Inserts of e and f are the enlarged images of fine recrystallized grains outlined by magenta dashed squares in e and f, respectively. g Transmission electron microscopy (TEM) bright-field (BF) image and SAED pattern revealing high-density dislocation walls and large numbers of fine dislocation cells in the CR alloy. j High-resolution TEM (HRTEM) image of deformed grains interior showing nano-spaced SFs (blue arrows) and widely existed dislocation locks in the CR alloy. h, k High-angle annular dark-field scanning transmission electron microscopy (HAADF-STEM) image and corresponding electron dispersive spectrometry (EDS) map about the Ti distribution exhibiting the Ti-rich particles; the inserted SAED patterns in h confirming that these particles in the CRA alloy are the L12 phase. i TEM-BF image of partially recrystallized microstructure showing numbers of annealing twins (yellow dashed lines) and SFs (blue arrows) exist in the CRAA alloy. l TEM dark-field (DF) image and SAED pattern revealing that there are L12-type particles with a high number density and an average diameter lower than 5 nm precipitating in the CRAA alloy. The scale bars in a–c, g–l are 10 μm, 20 μm, 20 μm, 200 nm, 500 nm, 200 nm, 20 nm, 500 nm, and 20 nm, respectively.

