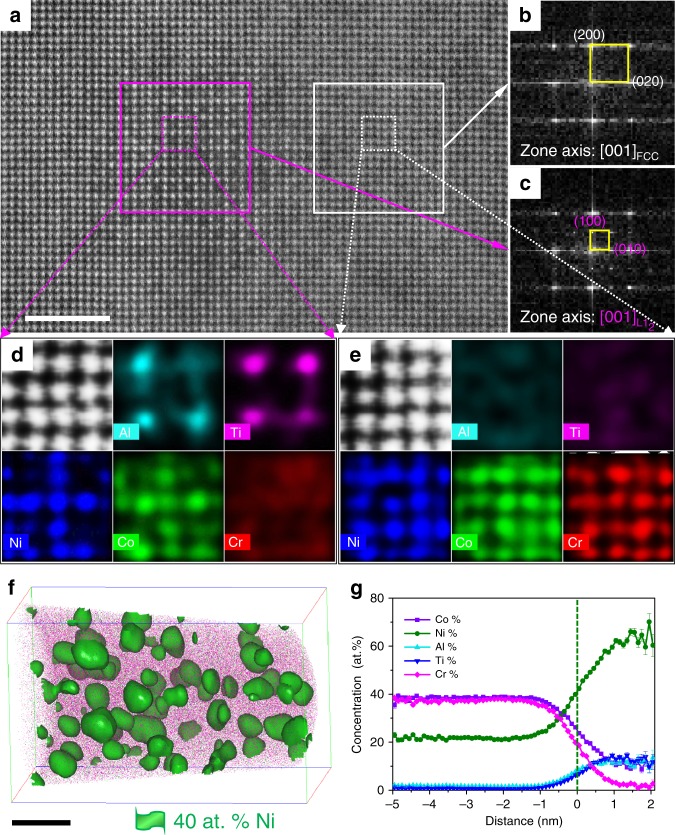
Fig. 3. The microstructure of the CRAA alloy.
a The atomic-resolution HAADF-STEM image taken from [001] zone axis. Scale bar, 2 nm. b, c FFT patterns corresponding to areas outlined by magenta and white solid squares in a, respectively. d, e Atomic-resolution EDS maps corresponding to areas outlined by magenta and white dashed squares in a, respectively. f The three-dimensional reconstruction of 40 at% Ni iso-concentration surfaces presenting the morphologies of the fine particles (with an average diameter of 4.14 ± 0.62 nm) and matrix, respectively. Scale bar, 10 nm. g One-dimensional concentration profile showing the element distributions from matrix to Ni-enriched particle. Error bars, SD.

