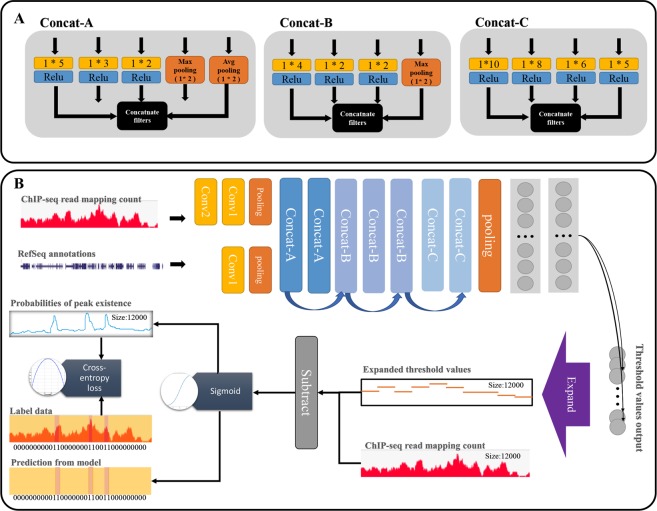
Figure 2.
The schema of CNN-peaks model. (A) There are three Inception-like modules: Concat-A, Concat-B, and Concat-C. Each yellow box represents a convolution operation with filter size 1 * N, and black boxes concatenate filters, which are constructed by combining several convolution and pooling outputs. (B) Our model learns optimal threshold values for calling peaks in local genomic segments of ChIP-seq data and determines the presence or absence of peaks using a subtraction of the threshold from each input signal value, and a sigmoid operation. Blue arrows indicate residual connections between Inception modules, and a purple arrow an operation for expanding output vectors.

