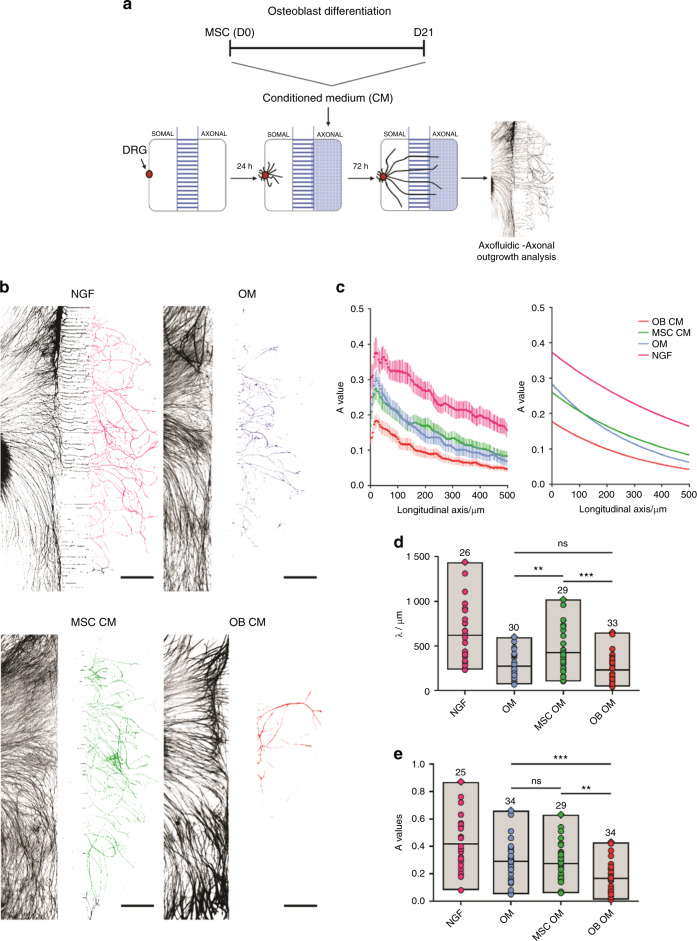
Fig. 2.
The secretome of mature OB applied locally to sensory axons, alters their behavior, and impairs their growth. a Scheme of the experimental setup and timeline employed in these experiments. b Representative images used for the quantification of the axonal growth upon 72 h exposure to standard neuronal growth medium containing NGF (positive control), osteogenic medium (OM), undifferentiated (MSC CM), and mature osteoblasts (OB CM) conditioned medium (axons stained against βIII-tubulin; scale bar—500 µm). c The combined plot of the data obtained using Axofluidic from all of the quantified microfluidic devices in the different conditions (left), and corresponding graphical representation of the exponential model (right), described by the spatial dependence decay function in the form , that best fits the data. A value represents the amount of axons that cross the microgrooves and reach the axonal side, whereas in the longitudinal axis is represented the distance from the microgrooves (in µm). d, e Graphical representation of all A values (c) and λ values (d) in the different conditions. Results are presented as floating bar graphs (line represents the mean value, and the number above each bar represents the number of microfluidic devices that were analyzed; **P < 0.01; ***P < 0.001, ns non-significant)

