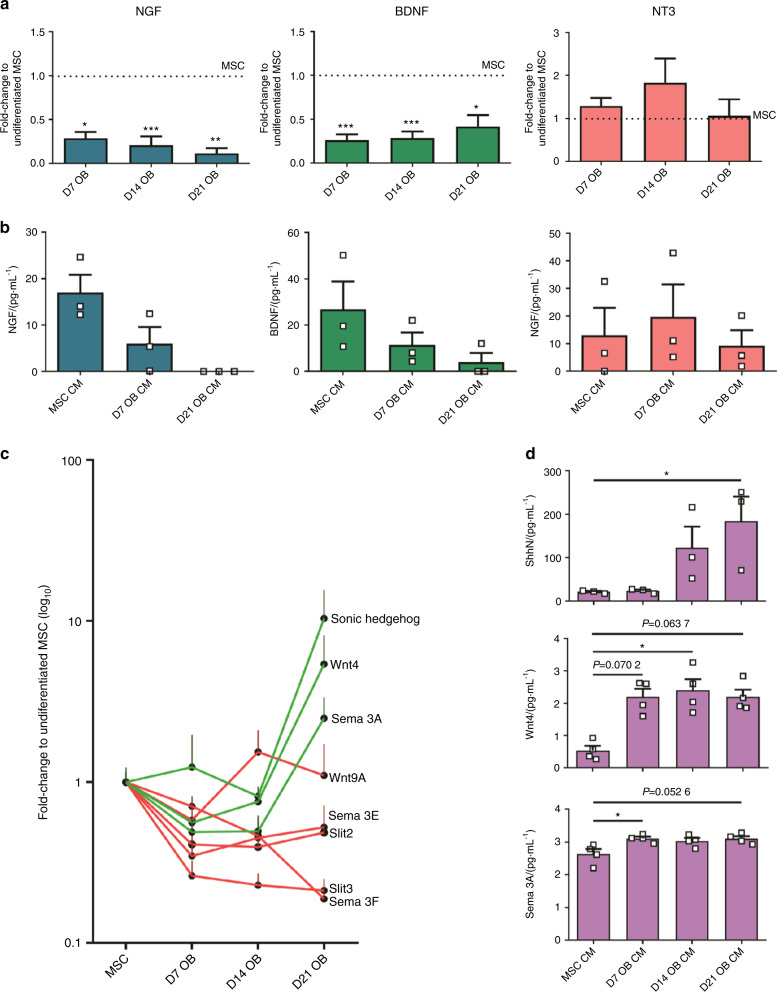
Fig. 5.
OB differentiation downregulates the expression of neurotrophic factors and upregulates the expression of axonal repulsive cues. a Gene expression analysis of NGF, BDNF, and NT-3. Values normalized to the values of undifferentiated MSC (horizontal dashed line). b ELISA analysis of NGF, BDNF, and NT-3 in the conditioned medium of OB at different stages of differentiation. c Fold-change variation in the gene expression of the selected axonal repulsive cues throughout OB differentiation. Values normalized to the values of undifferentiated MSC. Red lines depict the proteins that downregulated or showed no significant changes. Green lines depict the proteins that upregulated. d ELISA analysis of Shh, Sema3A, and Wnt4 in the conditioned medium of OB at different stages of differentiation. *P < 0.05; **P < 0.01; ***P < 0.001

