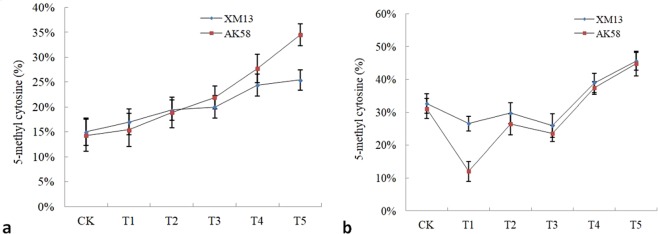
Figure 1.
Content of 5mC in wheat seedlings quantified by HPLC. (a) 5mC content in leaf of wheat XM13 or wheat AK58, (b) 5mC content in root of wheat XM13 or wheat AK58. CK, T1, T2, T3, T4 or T5 represented the treatment with 0.00, −0.05, −0.15, −0.30, −0.50, −0.75 MPa PEG6000 solution, respectively. The error bar was standard error of mean, the different lowercase letters above bars separately indicated significant difference of DNA methylation among treatments of two wheat cultivars (P < 0.05).

