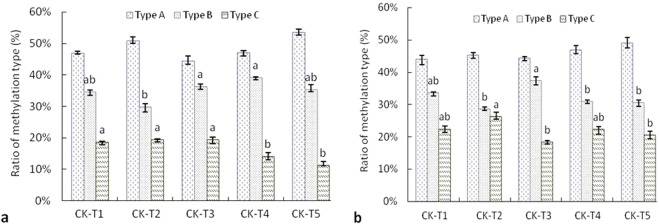
Figure 2.
Methylation status in leaf of wheat seedlings under water deficit. (a,b) represented the ratio of methylation type in leaf of wheat XM13 or wheat AK58, respectively. CK, T1, T2, T3, T4 and T5 indicated wheat seedlings under different osmotic potentials of PEG6000 solution with 0.00, −0.05, −0.15, −0.30, −0.50 or −0.75 MPa, respectively. Type A: methylation monomorphism, ratio of Type A (%) = (band A2 + band A3)/(total methylation bands) ×100; Type B: methylation type, ratio of Type B (%) = (band B1 + band B2 + band B3 + band B4 + band B5)/(total methylation bands) × 100; Type C: demethylation type, ratio of Type C (%) = (band C1 + band C2 + band C3)/(total methylation bands) × 100; Total methylation bands = bands of Type A + bands of Type B + bands of Type C. The error bar was standard error of mean, the different lowercase letters above bars represented the significant difference among treatments of the same methylation type (P < 0.05).

