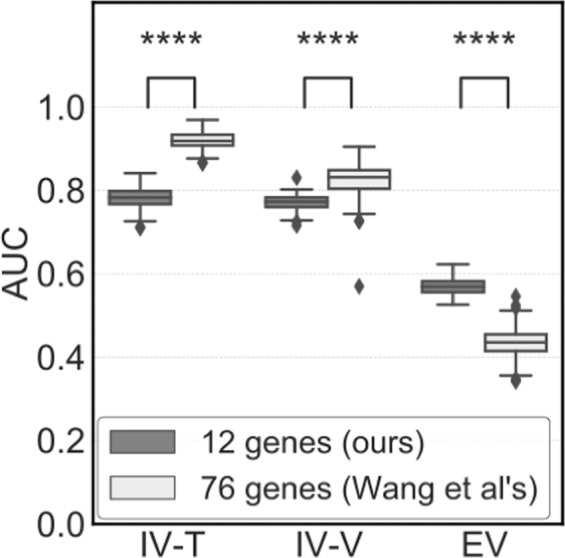
Figure 3.

Prediction performance of MLR models of 12 and 76 genes (Exp. 2). AUC values to discriminate between patients with or without metastasis. As model optimisation for independent datasets, the set of gene signatures selected in the process of k-fold CV gene selection in Fig. 1 was normalised using Z-score. Training and validation datasets were generated by 200 random splits of (a) GSE2034 as the internal validation dataset (IV-T, IV-V) and (b) the TRANSBIG dataset including GSE6532 and GSE7390 as the external validation dataset (EV). The difference in AUC values was evaluated by Mann-Whitney tests. The values of the median, and 1st and 3rd quartiles are plotted by horizontal bars. Data outside more than one and a half times the length of the boxplot (3rd quartile minus 1st quartile; interquartile range) were plotted. Significant differences are shown (*P < 0.05, **P < 0.01, ***P < 0.005, and ****P < 0.001).
