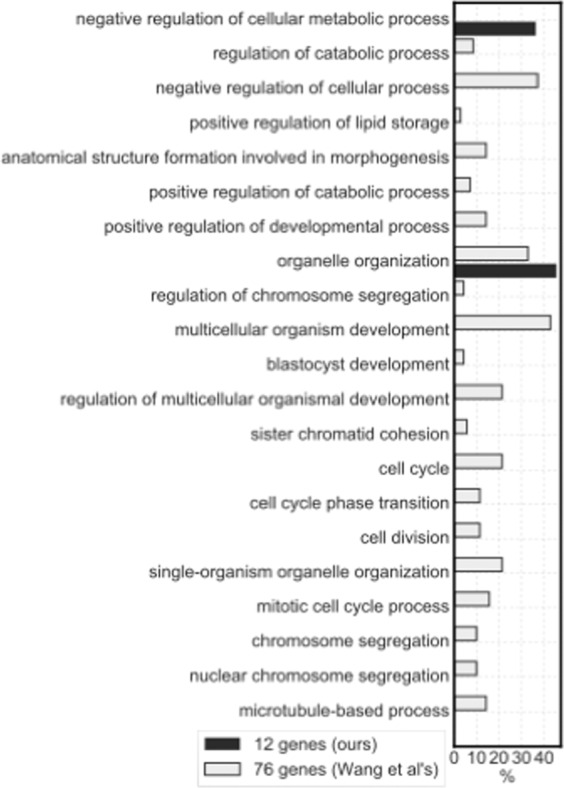
Figure 4.

Gene ontology included in the genes selected from the public microarray dataset and gene sets reported by Wang et al. The percentage of each functional annotation indicates the appearance frequency. To normalise the number of each functional annotation, the ratio of the number of gene ontology terms (GOTERMs) to the total number of selected genes is shown. The GOTERM category focuses on the third threshold of the biological process in DAVID Bioinformatics Resources 6.8.
