
Figure 2.
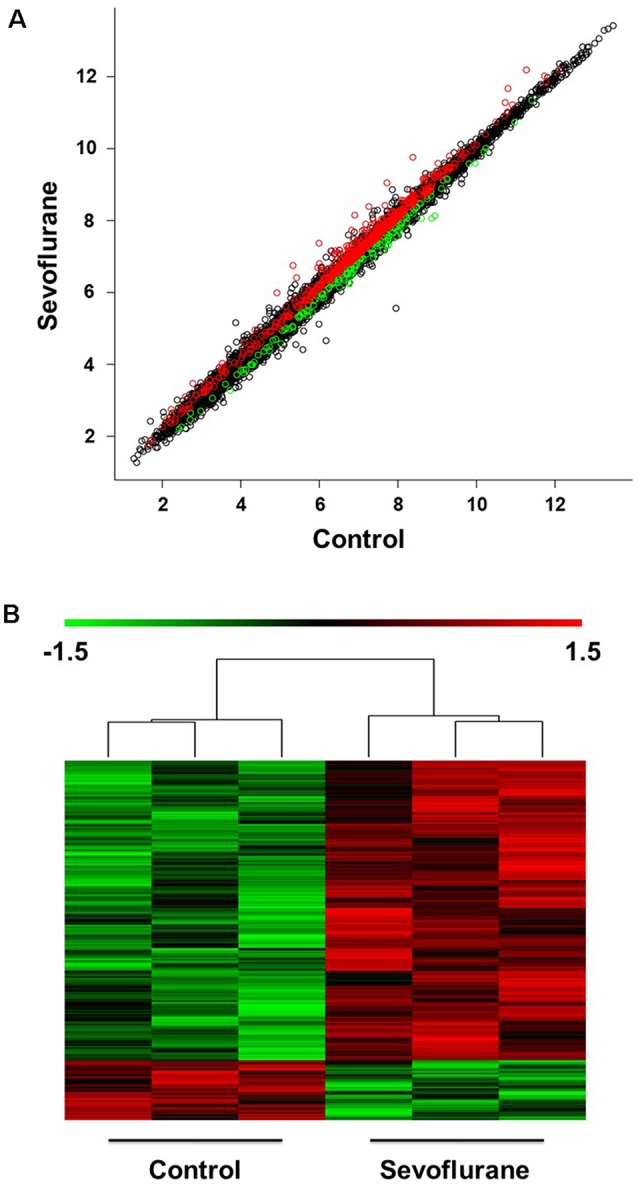
Differential expression of mRNAs in the hippocampus (n = 6). (A) The scatter plot indicated the variation in hippocampal gene expressions between the sevoflurane group and control condition. The values corresponding to the X- and Y-axes in the scatter plot are the normalized signal values of the control and sevoflurane groups (log2 scaled). (B) Hierarchical cluster analysis showed differentially expressed genes between groups from microarray analysis (p < 0.05).