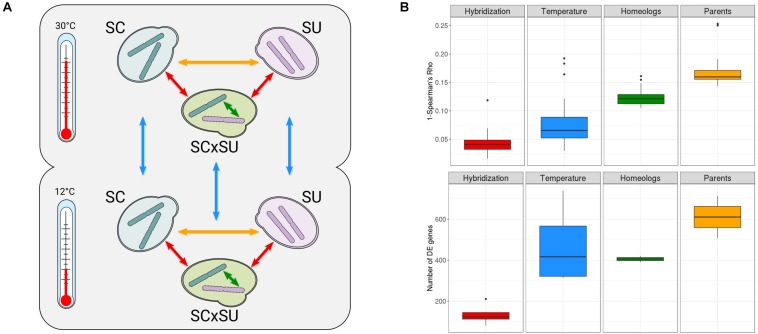
FIGURE 1.
(A) Experimental design of the study (see section “Materials and Methods”). Arrows indicate comparisons of the expression levels enabled by this design: across parentals (yellow), genetic backgrounds (red), homeologous genes (green), and temperature conditions (blue). (B) Overall transcriptomic changes assessed as 1-Spearman’s rho correlation (top row) and the number of differentially expressed (DE) genes (bottom row). “Hybridization”—comparisons between parentals and hybrid at both temperatures; “Temperature”—comparisons of all species at two different temperatures; “Homeologs”—comparisons between homeologous genes at both temperatures; “Parents”—comparisons between parentals at both temperatures. Colors correspond to the comparisons depicted in A. A more detailed comparison for each of the above categories is depicted in Supplementary Figure S6.

