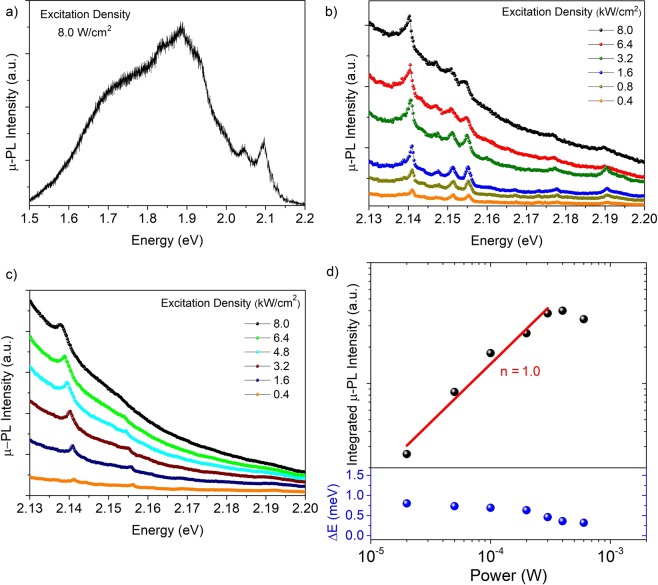
Figure 3.
(a) µ-PL spectrum acquired at the tip of the GaP structure at 5 K under low excitation density (8.0 W/cm2) regime. (b) and (c) 5K µ-PL spectra under different excitation densities in the high power regime (≥ 0.1 kW/cm2). The two set of spectra were acquired at different positions on the GaP structure, at the tip and in the body segment, respectively. (d) Integrated µ-PL intensity and energy shift of the peak at 2.14 eV as function of the excitation power.

