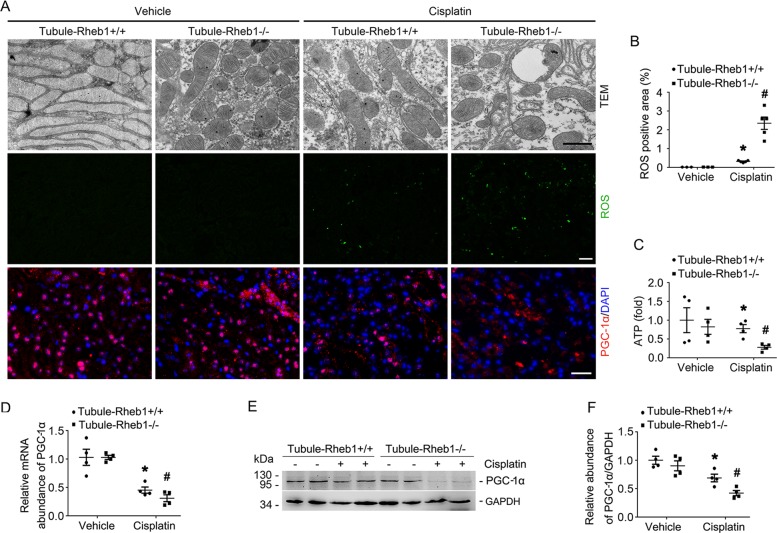
Fig. 4. Specific ablation of Rheb1 in tubular cells aggravates PGC-1α downregulation and mitochondrial defect in kidney tubule from mice after cisplatin injection.
a Representative transmission electron micrographs of tubular cells from Tubule-Rheb1+/+ and Tubule-Rheb1−/− mice, Scale bar = 2 μm; Representative micrographs showing DCFH-DA staining for ROS (Scale bar = 20 μm) and immunofluorescent staining for PGC-1α in kidney tissues (Scale bar = 20 μm). For PGC-1α staining, kidney sections were counterstained with DAPI. b Quantitative analysis of DCFH-DA -staining positive area among groups as indicated. Data is presented as the percentage of the staining positive area. *P < 0.05 vs. Vehicle control, n = 3–5, #P < 0.05 vs. Tubule-Rheb1+/+ mice injected with cisplatin, n = 5. Each dot represents the average of five HPFs from each mouse. c The graph showing the ATP level in kidneys from Tubule-Rheb1+/+ and Tubule-Rheb1−/− mice respectively. *P < 0.05 vs. Vehicle control, n = 4, #P < 0.05 vs. Tubule-Rheb1+/+ mice injected with cisplatin, n = 4. d Real-time q-PCR analysis showing the mRNA abundance for PGC-1α in the kidneys. e, f Western blot assay (e) and quantitative analysis (f) showing the abundance of PGC-1α in the kidneys. *P < 0.05 vs. Vehicle control, #P < 0.05 vs. Tubule-Rheb1+/+ mice injected with cisplatin, n = 4.

