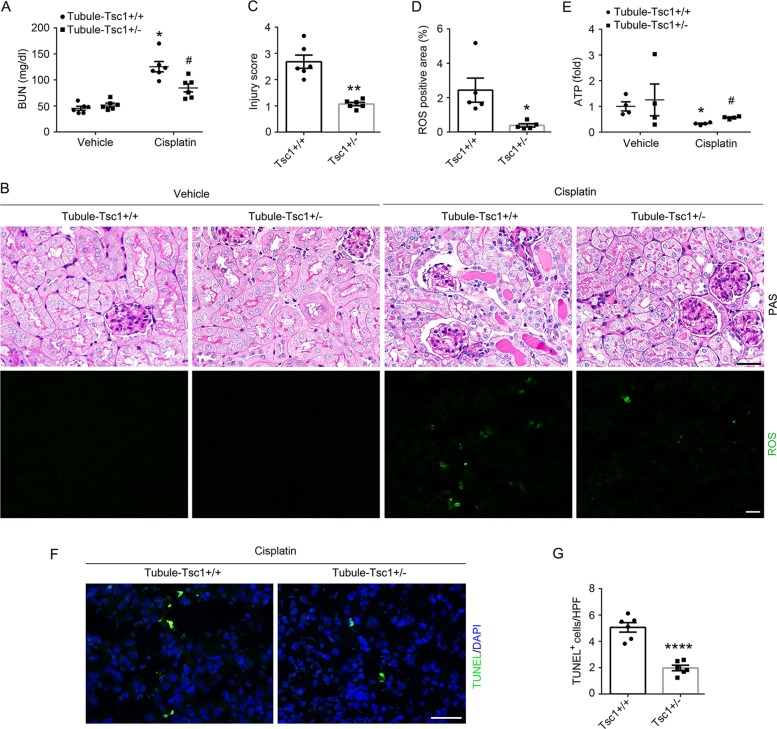
Fig. 7. Tubular cell-specific genetic activation of mTORC1 signaling in mice prevents cisplatin-induced tubular cell death and AKI.
a The graph showing blood urea nitrogen (BUN) level in Tubule-Tsc1+/− and Tubule-Tsc1+/+ mice. *P < 0.05 vs. Vehicle control, #P < 0.05 vs. Tubule-Tsc1+/+ mice injected with cisplatin, n = 6. b Kidney histology as shown by periodic acid-Schiff staining and representative micrographs of DCFH-DA staining for ROS. Scale bar = 20 µm. c Injury scores. **P < 0.01 vs. Tubule-Tsc1+/+ mice injected with cisplatin, n = 6. d Quantitative analysis of DCFH-DA-positive area among groups as indicated. Data is presented as the percentage of the staining positive area. *P < 0.05 vs. Tubule-Tsc1+/+ mice injected with cisplatin, n = 5. Each dot represents the average of five LPFs from each mouse. e The graph showing the ATP level in kidney tissues of Tubule-Tsc1+/+ and Tubule-Tsc1+/− mice. *P < 0.05 vs. Vehicle control, n = 4, #P < 0.05 vs. Tubule-Tsc1+/+ mice injected with cisplatin, n = 4. f Representative micrographs showing TUNEL staining for apoptotic cells. Scale bar = 20 µm. g Quantitative analysis of TUNEL-staining positive cells among groups as indicated. Data is presented as the number of TUNEL-staining positive cells per field (×400). ****P < 0.0001 vs. Tubule-Tsc1+/+ mice injected with cisplatin, n = 6. Each dot represents the average of five HPFs from each mouse.

