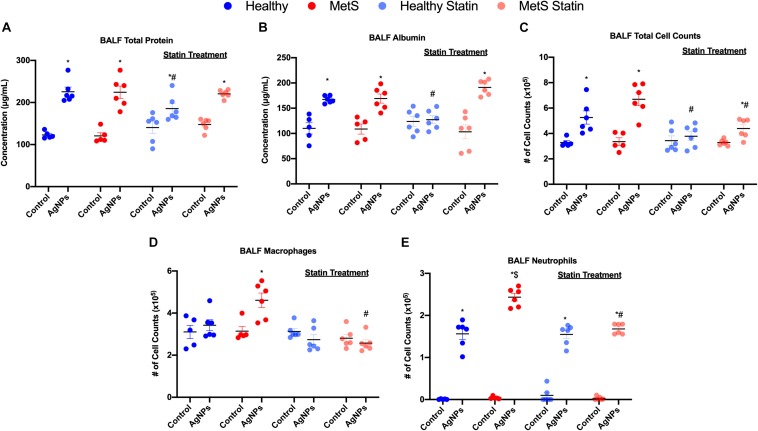
FIGURE 2.
Effect of AgNP exposure on BALF (A) total protein, (B) albumin, (C) total cells, (D) macrophages and (E) neutrophils from healthy and MetS mice and the influence of statin treatment. Values are expressed as mean ± SEM (n = 5–6). * denotes significant differences due to AgNP exposure, $ denotes significant differences between healthy and MetS mouse models, # denotes significant differences due to statin treatment (p < 0.05).

