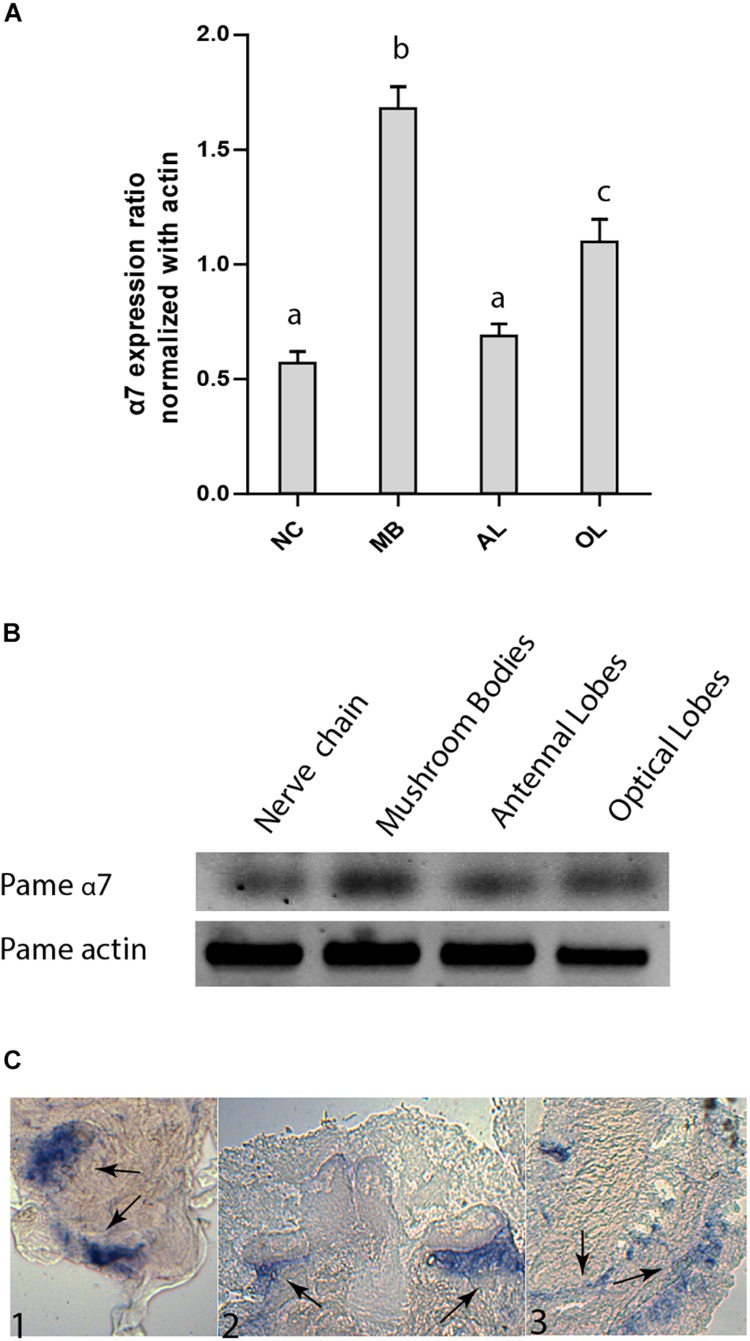
FIGURE 3.
Expression pattern of Pameα7 subunit in the cockroach nervous system. (A) Expression level of Pameα7 using semi-quantitative RT-PCR experiments. Data are shown as expression ratio normalized with actin. Expression pattern was determined in the nerve chain (NC), antennal lobes (AL), mushroom bodies (MB) and optical lobes (OL). Significant differences are designated by different letters. (B) Electrophoresis showing Pameα7 and actin (used as quantitative and positive control). Dara are the mean of four independent experiments. Significant difference was determined using one-way ANOVA and Bonferroni post hoc test. All statistical analyses were added in Supplementary Figure S1C. (C) In situ hybridization of Pameα7 mRNA on cockroach adult brain. Expression is detected in the antennal lobes (C1), the non-compact Kenyon cells of the mushroom bodies (C2) and the optic lobes (C2).

