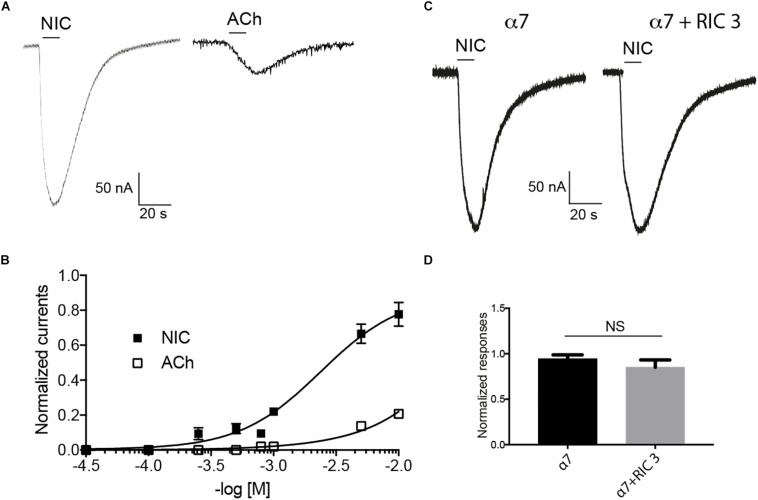
FIGURE 4.
Effect of nicotine (Nic) and acetylcholine (ACh) on cockroach α7 nAChRs expressed in Xenopus laevis oocytes. (A) Typical example of nicotine- and acetylcholine-induced currents. Currents are recorded at 10 mM nicotine or acetylcholine, respectively. (B) Dose-response curve are represented for nicotine and acetylcholine. Data are normalized to 10 mM nicotine and each point represents a mean ± S.E.M of n = 12 tested oocytes. (C,D) Nicotine (10 mM) evoked currents recorded after the expression of cockroach α7 subunit alone or with rat RIC-3. Each histogram represents mean ± S.E.M of n = 10 oocytes. NS = no significant difference using one-way ANOVA and Bonferroni post hoc test.

