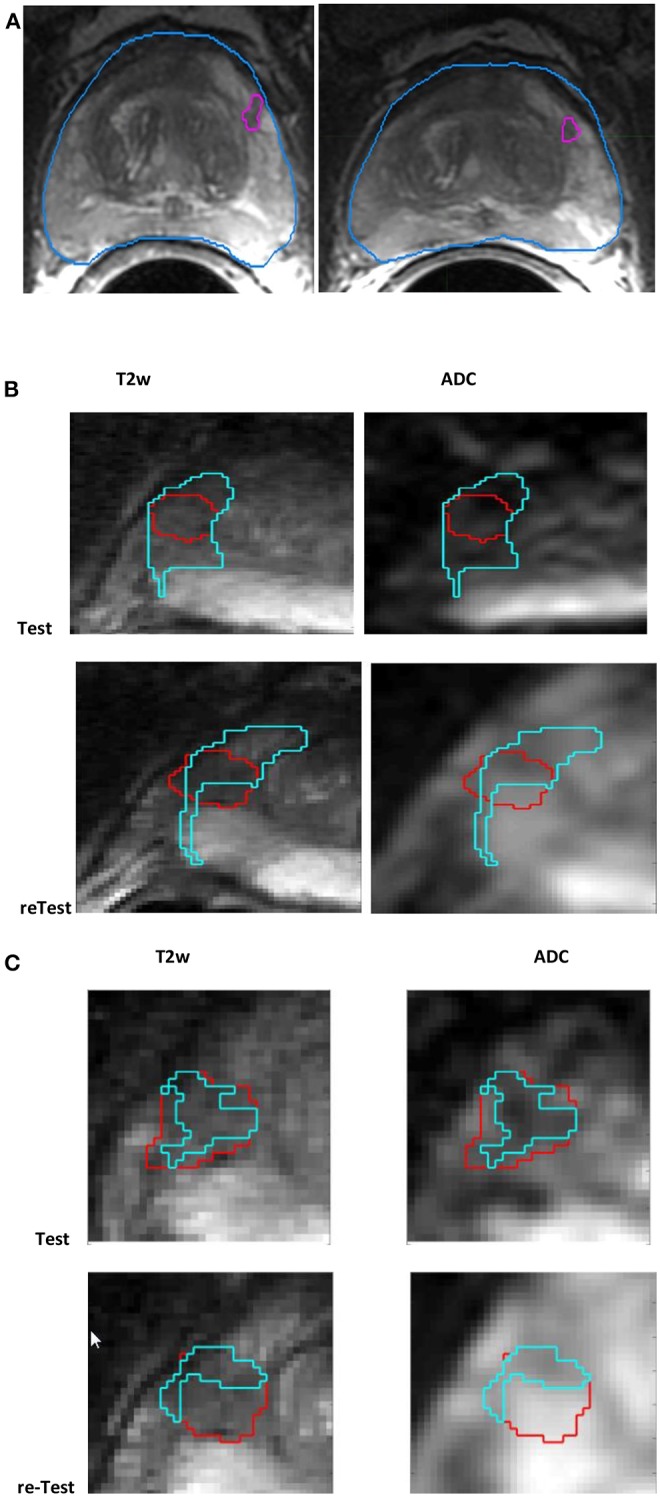
Figure 1.

Screen capture of mpMRI prostate scan (A) with radiologist-marked lesion shown for the baseline and follow-up scans in T2w, (B) habitat converged with a sphere (15mm), and (C) habitat (≤ median) (in cyan) for a lesion (in red) shown for test and retest (along the rows) in T2w, ADC (along the column).
